
คำอธิบาย
ระดับตัวเลขกลม - ตัวบ่งชี้สำหรับ cTrader
คำอธิบาย
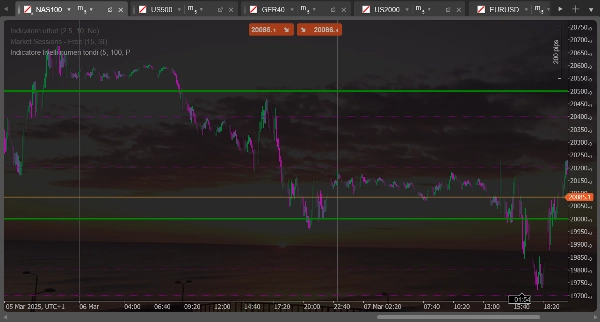
ตัวบ่งชี้นี้วาดเส้นแนวนอนที่ "ตัวเลขกลม" หรือระดับที่มีความสำคัญทางจิตวิทยาบนกราฟ เหมาะสำหรับการระบุพื้นที่สนับสนุนและต้านทานที่เป็นไปได้โดยอิงจากระดับราคากลมที่มักมีความสำคัญทางจิตวิทยาสำหรับเทรดเดอร์
คุณสมบัติหลัก
- วาดชุดเส้นแนวนอนสองชุดที่แตกต่างกันในช่วงเวลาปกติ
- คำนวณระดับโดยอัตโนมัติตามราคาปิดปัจจุบัน
- อัปเดตแบบไดนามิกเมื่อราคาขยับ
- มีการตั้งค่าแยกสำหรับแต่ละชุดของเส้น (สี, สไตล์, ขนาด)
การปรับแต่งที่เป็นไปได้
สำหรับชุดเส้นแรก (เส้นประ)
- จำนวนเส้นชุดที่ 1: กำหนดจำนวนเส้นที่จะวาดเหนือและใต้ราคาปัจจุบัน (ค่าเริ่มต้น: 5)
- ขนาดช่วงชุดที่ 1: กำหนดระยะห่างระหว่างเส้นเป็นพิป (ค่าเริ่มต้น: 100 พิป)
- สีเส้นชุดที่ 1: ปรับแต่งสีของเส้น (ค่าเริ่มต้น: สีม่วง)
- ความหนาเส้นชุดที่ 1: กำหนดความหนาของเส้น (ค่าเริ่มต้น: 1 พิกเซล)
สำหรับชุดเส้นที่สอง (เส้นทึบ)
- จำนวนเส้นชุดที่ 2: กำหนดจำนวนเส้นที่จะวาดเหนือและใต้ราคาปัจจุบัน (ค่าเริ่มต้น: 2)
- ขนาดช่วงชุดที่ 2: กำหนดระยะห่างระหว่างเส้นเป็นพิป (ค่าเริ่มต้น: 500 พิป)
- สีเส้นชุดที่ 2: ปรับแต่งสีของเส้น (ค่าเริ่มต้น: สีเขียว)
- ความหนาเส้นชุดที่ 2: กำหนดความหนาของเส้น (ค่าเริ่มต้น: 1 พิกเซล)
การใช้งานในทางปฏิบัติ
โดยทั่วไป ชุดแรก (เส้นประ) ใช้เพื่อระบุระดับจิตวิทยาย่อย ในขณะที่ชุดที่สอง (เส้นทึบ) เน้นระดับจิตวิทยาหลัก ตัวอย่างเช่น สำหรับ EURUSD คุณอาจตั้งค่าชุดแรกให้แสดงระดับทุก 100 พิป (เช่น 1.0800, 1.0900) และชุดที่สองสำหรับระดับทุก 500 พิป (เช่น 1.0500, 1.1000)
ระดับเหล่านี้มักตรงกับโซนสนับสนุนหรือความต้านทานที่ราคาสามารถเด้งกลับหรือชะลอตัวก่อนที่จะเคลื่อนไหวต่อไป
Round Number Levels - Indicator for cTrader
Description
This indicator draws horizontal lines at "round numbers" or psychologically significant levels on the chart. It's ideal for identifying potential support and resistance areas based on round price levels that often have psychological importance for traders.
Main Features
- Draws two distinct sets of horizontal lines at regular intervals
- Automatically calculates levels based on the current closing price
- Updates dynamically as price moves
- Offers separate configuration for each set of lines (color, style, size)
Possible Adjustments
For the first set of lines (dashed)
- Number of Lines Set 1: Determines how many lines to draw above and below the current price (default: 5)
- Range Size Set 1: Sets the distance between lines in pips (default: 100 pips)
- Line Color Set 1: Customizes the color of the lines (default: purple)
- Line Width Set 1: Sets the thickness of the lines (default: 1 pixel)
For the second set of lines (solid)
- Number of Lines Set 2: Determines how many lines to draw above and below the current price (default: 2)
- Range Size Set 2: Sets the distance between lines in pips (default: 500 pips)
- Line Color Set 2: Customizes the color of the lines (default: green)
- Line Width Set 2: Sets the thickness of the lines (default: 1 pixel)
Practical Usage
Typically, the first set (dashed lines) is used to identify minor psychological levels, while the second set (solid lines) highlights major psychological levels. For example, for EURUSD, you might set the first set to show levels every 100 pips (such as 1.0800, 1.0900) and the second set for levels every 500 pips (such as 1.0500, 1.1000).
These levels often coincide with support or resistance zones where price might bounce or slow down before continuing its movement.
สรุป
รีวิวจากลูกค้า
5 | 50 % | |
4 | 50 % | |
3 | 0 % | |
2 | 0 % | |
1 | 0 % |


