Описание
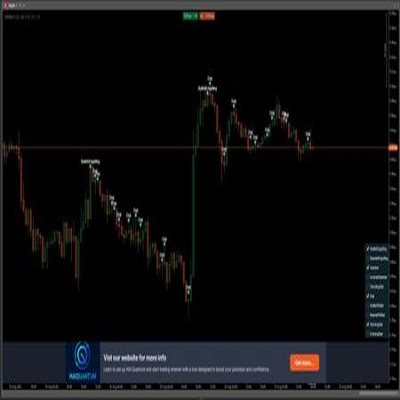
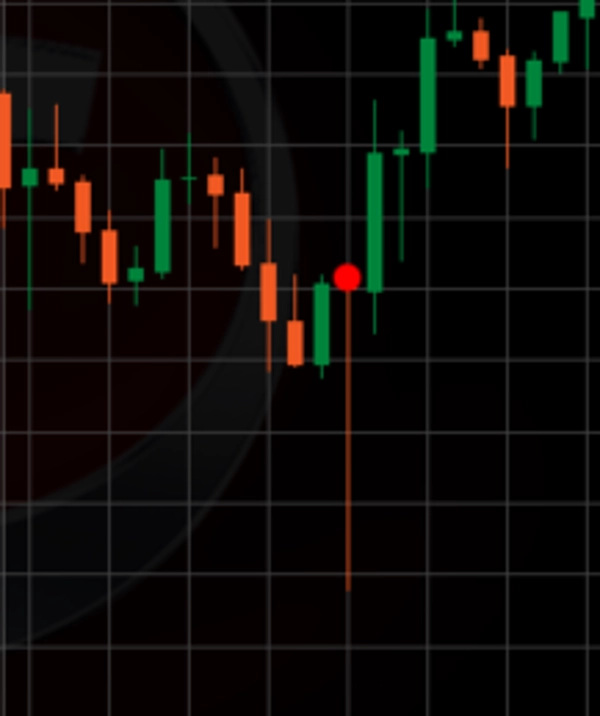
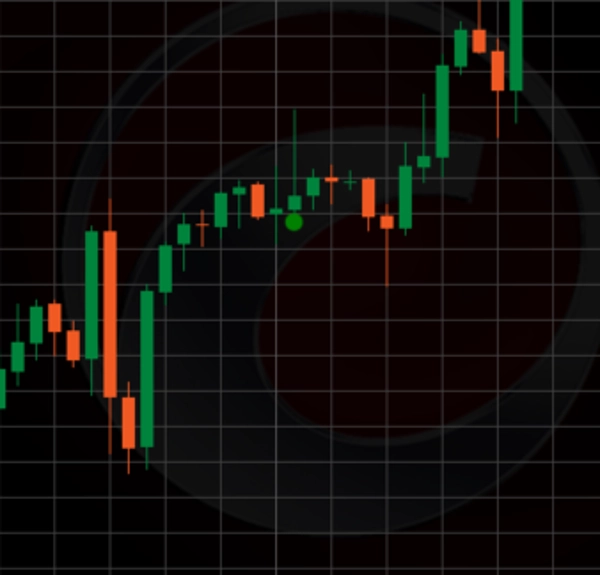
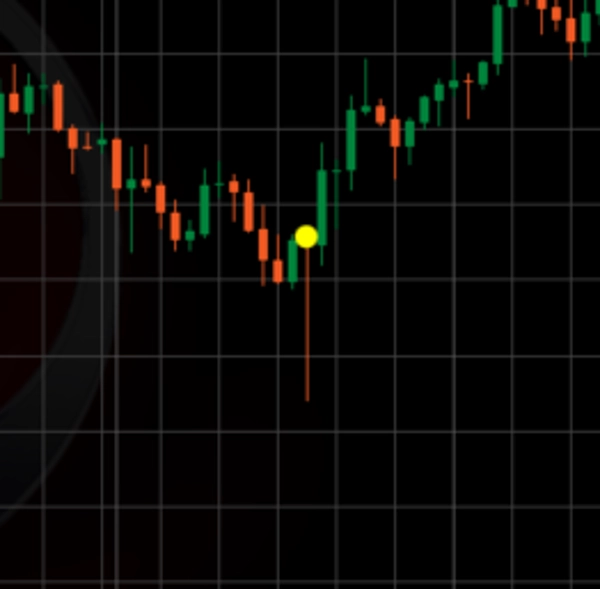
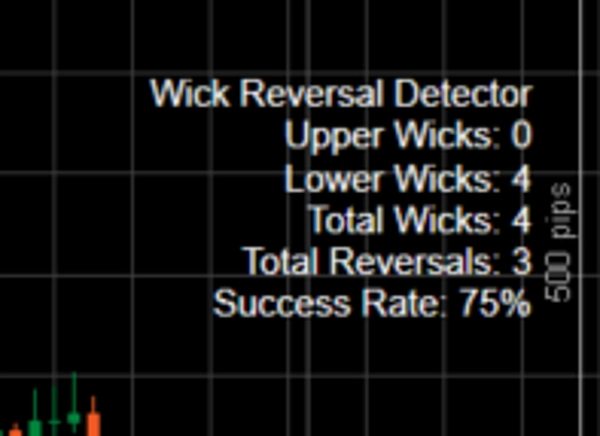
Индикатор Long Wick — это мощный инструмент технического анализа, созданный для cTrader, который сосредоточен на выявлении свечей с необычно длинными тенями — верхними или нижними — относительно размера их тела и среднего диапазона свечи. Он выделяет эти тени на графике как потенциальные точки разворота, где рынок мог отвергнуть более высокие цены (для верхних теней, что указывает на медвежий разворот) или более низкие цены (для нижних теней, что указывает на бычий разворот). Индикатор использует комбинацию множителя порога тени, минимального соотношения тени к телу и фильтрующей тренд простой скользящей средней (SMA), чтобы отфильтровать шум и сосредоточиться на значимых паттернах отторжения цены. Каждая обнаруженная тень отмечается кружком (зелёным для верхних теней, красным для нижних, если подтверждена как разворот, или жёлтым, если нет), а статистические данные (например, общее количество теней, разворотов и уровень успешности) отображаются на графике для удобного отслеживания.
Как использовать в торговле:
- Определение возможностей для разворота: Используйте индикатор для обнаружения длинных теней, которые появляются на ключевых уровнях поддержки или сопротивления, либо против преобладающего тренда (например, длинная нижняя тень в нисходящем тренде для потенциального бычьего разворота). Яркий зелёный или красный кружок указывает на подтверждённый разворот на основе ценового действия в течение периода подтверждения, что является сигналом рассмотреть вход в сделку в противоположном направлении (например, покупка при красном нижнем развороте, продажа при зелёном верхнем развороте).
- Подтверждение с другими инструментами: Сочетайте индикатор Long Wick с другими техническими индикаторами (например, RSI, MACD или линиями поддержки/сопротивления) для подтверждения сигналов разворота и избежания ложных срабатываний, особенно на волатильных рынках.
- Управление рисками: Размещайте стоп-лоссы за пределами экстремума тени (например, ниже минимума при бычьем развороте), чтобы защититься от возможного провала разворота, и устанавливайте уровни тейк-профита на основе ближайших уровней поддержки/сопротивления или соотношения риск/прибыль (например, 1:2).
- Мониторинг уровня успешности: Регулярно проверяйте отображаемый уровень успешности, чтобы оценить эффективность индикатора со временем и при необходимости корректировать свою стратегию.
Настройка параметров для оптимального использования:
- Период обратного просмотра (по умолчанию: 5): Определяет количество баров, используемых для расчёта среднего диапазона свечи. Более короткий период (например, 3-10) делает индикатор более чувствительным к недавней волатильности, что идеально для быстро меняющихся рынков, тогда как более длинный период (например, 20-50) сглаживает среднее для трендовых условий. Настраивайте в зависимости от вашего таймфрейма (например, меньше для 1-минутных графиков, больше для часовых).
- Период подтверждения (по умолчанию: 15): Устанавливает количество баров для подтверждения разворота. Более короткий период (например, 5-10) подходит для быстрых скальпинговых стратегий, тогда как более длинный (например, 15-30) лучше для свинг-трейдинга, чтобы захватить продолжительные развороты. Увеличивайте, если замечаете слишком много жёлтых отметок, где развороты происходят позже.
- Множитель порога тени (по умолчанию: 1.3): Умножает средний диапазон свечи для установки минимальной длины тени. Более низкие значения (например, 1.0-1.5) обнаруживают больше теней (полезно на рынках с низкой волатильностью), тогда как более высокие значения (например, 2.0-3.0) фильтруют только самые значительные тени (лучше на рынках с высокой волатильностью). Настраивайте для баланса чувствительности и качества сигнала.
- Период тренда (SMA) (по умолчанию: 21): Определяет длину SMA для фильтрации тренда. Более короткий период (например, 10-20) реагирует на краткосрочные тренды, тогда как более длинный (например, 50-100) соответствует долгосрочным трендам. Настраивайте в соответствии с вашим торговым горизонтом и рыночными условиями.
- Минимальное соотношение тени к телу (по умолчанию: 3): Устанавливает минимальное соотношение длины тени к размеру тела. Более низкое соотношение (например, 2-3) включает больше свечей с умеренными тенями, тогда как более высокое (например, 4-5) фокусируется на свечах с очень выраженными тенями. Увеличивайте для более строгих сигналов разворота, уменьшайте для большего количества возможностей.
- Допуск разворота (в пунктах) (по умолчанию: 5): Позволяет допуск в пунктах для цены, чтобы она могла выйти за экстремум тени перед тем, как разворот будет дисквалифицирован. Меньшее значение (например, 2-3) обеспечивает строгую проверку разворота, тогда как большее (например, 5-10) учитывает незначительные откаты. Настраивайте в зависимости от стоимости пункта и волатильности символа.
Советы по оптимизации:
- Начинайте с настроек по умолчанию и проводите тестирование на исторических данных для вашего предпочтительного инструмента и таймфрейма.
- На трендовых рынках увеличивайте множитель порога тени и минимальное соотношение тени к телу, чтобы сосредоточиться на более сильных сигналах разворота.
- На флетовых рынках снижайте эти параметры, чтобы захватывать больше теней, но сочетайте с более коротким периодом подтверждения, чтобы избежать поздних дисквалификаций.
- Регулярно проверяйте уровень успешности и корректируйте параметры, если он опускается ниже приемлемого порога (например, 70%).
Настраивая эти параметры, трейдеры могут адаптировать индикатор Long Wick под свою конкретную стратегию, повышая его эффективность в выявлении точек разворота с высокой вероятностью в различных рыночных условиях.
Сводка
Traders can use the indicator to spot reversal opportunities at key support or resistance levels or against prevailing trends. It is recommended to confirm signals with other technical tools such as RSI or MACD and to apply risk management by placing stop-loss orders beyond wick extremes. The indicator’s parameters—including lookback and lookforward periods, wick threshold multiplier, SMA trend period, minimum wick-to-body ratio, and reversal tolerance—are adjustable to suit different market conditions and trading styles. Regular review of the success rate helps optimize performance.
Отзывы покупателей
5 | 0 % | |
4 | 100 % | |
3 | 0 % | |
2 | 0 % | |
1 | 0 % |