![Trading product for Trend Angle Indicator [Iridio Capital] Индикатор Forex Crypto, image 1](https://cdn.ctrader.com/image/webp/28a98496-3412-4fea-82eb-be3347bdd6f1_27612)
![Trading product for Trend Angle Indicator [Iridio Capital] Индикатор Forex Crypto, image 2](https://cdn.ctrader.com/image/webp/1831cdef-6a14-4f6e-9c0b-dfff3d168d29_27613)
Описание
Обзор
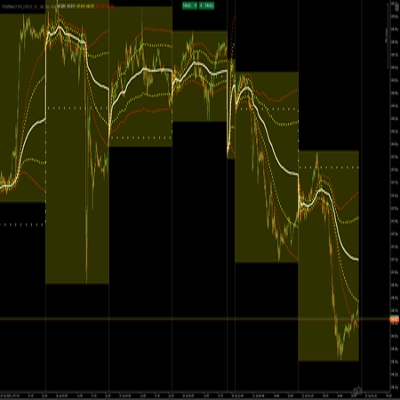
Индикатор угла тренда предоставляет ясный и интуитивно понятный способ визуализации рыночных трендов, вычисляя наклон (в градусах) линейной регрессии по заданному количеству баров. Вместо того чтобы полагаться на традиционные индикаторы тренда, которые могут быть сложны для интерпретации, этот инструмент предлагает простое угловое представление движения цены, что облегчает оценку силы и направления тренда с первого взгляда.
Как это работает
Линейная регрессия — это статистический метод, используемый для моделирования взаимосвязи между переменными — в данном случае движением цены во времени. Он находит линию наилучшего соответствия, минимизирующую отклонения от фактических значений цены, что позволяет определить наклон тренда. Преобразуя этот наклон в градусы, индикатор предоставляет естественный и интуитивно понятный способ оценки рыночных условий:
- 0° → Боковой рынок (отсутствие явного тренда)
- +25° до +60° → Восходящий тренд (больший наклон означает более сильный тренд)
- -25° до -60° → Нисходящий тренд (более крутые отрицательные углы указывают на более сильное падение)
Основные характеристики и преимущества
✅ Интуитивная визуализация тренда – Вместо произвольных значений индикатор выражает тренд в градусах, что облегчает понимание крутизны движения рынка.
✅ Определяет консолидацию и сильные тренды – Индикатор выделяет периоды консолидации рынка (когда угол находится между зелёной и красной горизонтальными линиями) и сильные бычьи или медвежьи тренды при пробое выше или ниже этих порогов.
✅ Цветовое выделение силы тренда – Области выше +25° (сильный восходящий тренд) и ниже -25° (сильный нисходящий тренд) затемнены, что позволяет мгновенно распознавать сильные движения.
✅ Работает на любом таймфрейме и активе – Независимо от того, торгуете ли вы акциями, форексом, криптовалютой или фьючерсами, этот инструмент помогает выявлять значимые тренды на разных рынках.
Как использовать
- Посмотрите на линию угла тренда:
-
- Если она находится между +25° и -25°, рынок консолидируется.
- Если она пробивает выше +25°, восходящий тренд усиливается.
- Если она опускается ниже -25°, формируется сильный нисходящий тренд.
- Используйте выделенные области для подтверждения сильного рыночного импульса.
- Комбинируйте с другими индикаторами (например, объёмом, скользящими средними) для дополнительного подтверждения.
Сводка
Key features include:
- Intuitive visualization of trend steepness expressed in degrees.
- Identification of market consolidation when the angle remains between +25° and -25°, and detection of strong bullish or bearish trends when breaking these thresholds.
- Color highlighting for quick recognition of strong uptrends (above +25°) and downtrends (below -25°).
- Compatibility with any timeframe and asset class, including stocks, forex, cryptocurrencies, and futures.
Users can monitor the trend angle line to determine market conditions, confirm momentum using highlighted regions, and combine this indicator with others such as volume or moving averages for enhanced analysis.
Отзывы покупателей
5 | 100 % | |
4 | 0 % | |
3 | 0 % | |
2 | 0 % | |
1 | 0 % |

![Логотип продукта "High-Low Divergence [Iridio Capital]"](https://cdn.ctrader.com/image/webp/443c4661-7abb-40f1-842f-4b6ec560649b_40914)
![Логотип продукта "Wyckoff Toolkit [Iridio Capital]"](https://cdn.ctrader.com/image/webp/8acfe6a1-6a8e-4578-9367-9df3af2b1801_27763)
![Логотип продукта "Smart Money Concepts (SMC) [Iridio Capital]"](https://cdn.ctrader.com/image/webp/28b69fd1-ef54-4bed-9487-07e78e883be4_40934)
![Логотип продукта "Gaussian Channel [Iridio Capital]"](https://cdn.ctrader.com/image/webp/7c039209-5573-4a54-a072-f9528b503103_41960)
![Логотип продукта "Inverse Fair Value Gap (iFVG) [Iridio Capital]"](https://cdn.ctrader.com/image/webp/a7a0633e-91b0-4604-a6a8-1a4c30f68b0f_41954)
![Логотип продукта "Session Volume Profile (SVP) [Iridio Capital]"](https://cdn.ctrader.com/image/webp/60a274e6-2495-4d49-83f3-42078e40dc91_40920)
![Логотип продукта "Forecast Indicator [Iridio Capital]"](https://cdn.ctrader.com/image/webp/1d489900-f3bc-4a0c-ac55-368b41f69703_41986)