
Institutional Volume Supply Demand
Индикатор
1.51K скачивания
Версия 1.0, Sep 2025
Windows, Mac
4.4
Отзывы: 5
Описание
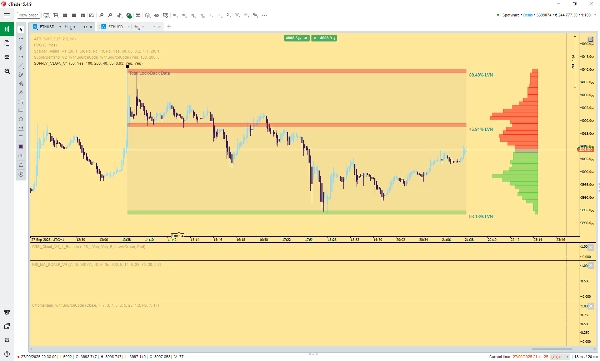
Зоны объемного профиля (Спрос/Предложение)
Индикатор Зоны объемного профиля предоставляет институциональный взгляд на структуру рынка, используя Объем по цене для анализа. Он автоматически определяет уровни поддержки и сопротивления с высокой вероятностью на основе рыночных неэффективностей и ликвидных пробелов.
Основные особенности:
- Институциональные уровни поддержки и сопротивления (LVN): Автоматически рассчитывает и отмечает узлы с низким объемом (LVN) — области, где цена быстро двигалась при минимальном объеме торгов. Эти LVN выступают как зоны будущего предложения (сопротивления) и спроса (поддержки) с высокой уверенностью.
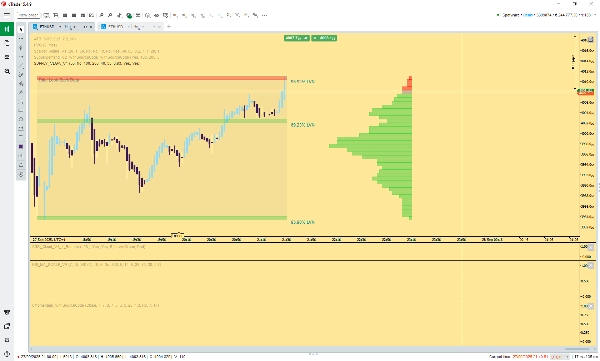
- Динамический период анализа: Профиль автоматически подстраивает период анализа, фокусируясь только на текущем крупном колебании или тренде, сбрасываясь после значительного поворота рынка.
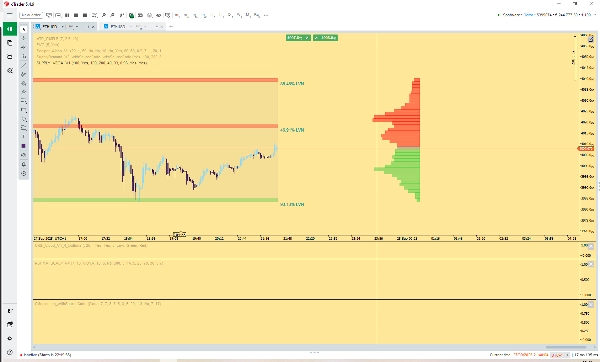
- Окраска относительно цены: Видимый гистограмма объемного профиля и соответствующие зоны спроса/предложения динамически окрашиваются в зависимости от текущей цены:
-
- Зеленый: Области объема ниже текущей цены (выступают как спрос/поддержка).
- Красный: Области объема выше текущей цены (выступают как предложение/сопротивление).
- Сила LVN: Зоны маркируются процентом, указывающим на слабость объема на этом уровне, предоставляя объективную меру теоретической силы зоны (размер ликвидного пробела).
Этот инструмент необходим трейдерам, использующим продвинутые методы анализа структуры рынка, потока ордеров или объемного профиля для выявления ключевых точек интереса и прогнозирования разворотов рынка.
Сводка
ИИ-сводка
The Institutional Volume Supply Demand indicator offers an advanced market structure analysis using Volume Profile Zones based on Volume at Price data. It automatically identifies key Support and Resistance levels by detecting Low Volume Nodes (LVNs), which represent areas where price moved rapidly with minimal trading volume, indicating potential future supply (resistance) and demand (support) zones. The indicator dynamically adjusts its look-back period to focus on the current major swing or trend, resetting after significant market pivots. It visually distinguishes supply and demand zones with color coding: green for volume areas below the current price (demand/support) and red for areas above (supply/resistance). Each LVN is labeled with a percentage that quantifies the weakness of volume at that level, providing an objective measure of zone strength based on liquidity void size. This tool supports traders employing advanced techniques such as order flow and Volume Profile analysis to identify high-probability market turning points. It is applicable across various markets including Forex pairs (e.g., EURUSD, GBPUSD, NZDUSD, USDJPY), cryptocurrencies (BTCUSD), indices (NAS100), and commodities (XAUUSD).
Профиль индикатора
Отзывы покупателей
4.4
Отзывы: 5
5 | 80 % | |
4 | 0 % | |
3 | 0 % | |
2 | 20 % | |
1 | 0 % |
Отзывы покупателей
May 15, 2026
CTrader's recent update has made this indicator obsolete. It simply stops CTrader from working. this Indicator needs an update to correlate with the Ctrader update.
April 8, 2026
November 3, 2025
Excelente indicador para quem opera baseado em zonas de liquidez, oferta e demanda institucional. Ótimo trabalho!
Обсуждение
Частые вопросы
BTCUSD
Forex
Signal
Breakout
EURUSD
GBPUSD
NZDUSD
Bollinger
Fibonacci
ZigZag
Scalping
Fair Value Gap
SMC
Grid
AI
XAUUSD
NAS100
MACD
USDJPY
VWAP
Продукты, доступные в cTrader Store, включая торговых ботов, индикаторы и плагины, предоставляются сторонними разработчиками и доступны исключительно в информационных и технических целях. cTrader Store не является брокером и не предоставляет инвестиционные консультации, персональные рекомендации или какие-либо гарантии будущей доходности.


![Логотип продукта "Smart Money Concepts (SMC) [Iridio Capital]"](https://cdn.ctrader.com/image/webp/28b69fd1-ef54-4bed-9487-07e78e883be4_40934)


Цена
С 09/01/2025
11.78K
Бесплатные установки