Описание
Индикаторы Pinescriptlabs Store: cBots Pinescriptlabs Store : (cBot) Gold & BTC BreakoutSession Pivots(новинка)
Advanced Market Structure: Bos, Choch, SwinLevels, Order Blocks, Market Structure & Liquidity Finder (Новинка)
ZigZag Price Liquidity Projection
Trailing Smart Algorithm (новинка)
Prediction Based on Linreg & ATR
SmartTrend Support &
Resistance
Lines
Динамический
Анализ
Структуры
Рынка
Точек
Поворота
Fibonacci
Linear
Regression
Multi-timeframe
Multi-Level
Candle Bias
Tracker
Auto
Support and
Resistance
Trend
Lines
All
Support and
Resistance
Levels
🌟 Отличная работа команды по разработке этого индикатора Ctrader! Поддержите нас, поделившись - скоро появятся визуальные улучшения, включая горизонтальную прокрутку!
⚠️ Техническое примечание: Для оптимального просмотра в настоящее время требуется ручное масштабирование/прокрутка ("Временное ограничение: лучше всего работает на таймфреймах ниже 1H из-за визуальных ограничений платформы Ctrader")
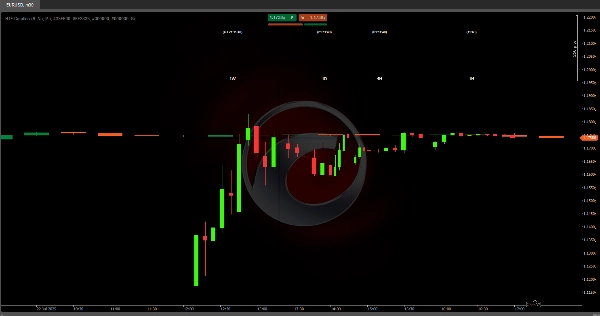
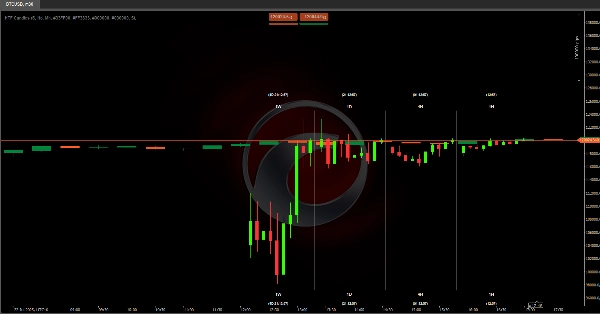
📊 Визуализация HTF в реальном времени
Этот алгоритм отображает свечи более высокого таймфрейма (1W, 1D, 4H, 1H) прямо на вашем торговом графике, предоставляя полную структуру рынка с первого взгляда - переключаться между окнами не нужно!
🔍 Быстрый анализ
Определяйте основные тренды (ежедневное/еженедельное направление) при торговле на более низких таймфреймах
• Расширенная функция: Свечи HTF обновляются в реальном времени - мгновенное изменение цвета показывает сдвиги импульса
⚙️ Как использовать
• Включайте/выключайте отдельные блоки HTF
• Настраивайте количество видимых свечей (1-10 на таймфрейм)
💡 Преимущества, меняющие правила игры
Теперь вы можете:
1️⃣ Предвидеть ключевые закрытия свечей
2️⃣ Обнаруживать развороты тренда в реальном времени
3️⃣ Одновременно отслеживать ключевые уровни на нескольких таймфреймах
🚀 Предстоящие улучшения
Горизонтальная прокрутка позволит:
• Анализ исторических паттернов HTF
• Сравнение текущей и прошлой структуры
• Определение ключевых зон на более высоких таймфреймах
📚 Практические примеры
• Когда 1W = зелёный & 1D = красный → Рынок корректируется в рамках бычьего тренда → Шорт только на отскоках от ключевого сопротивления
• Иерархия трендов: 1W > 1D > 4H > 1H → Всегда торгуйте в направлении недельной свечи
• Входы по конвергенции:
- Цена у поддержки 1D + появляющаяся зелёная свеча 4H = возможность для лонга
- Сопротивление на максимуме 1H + красная свеча 4H = шорт с стопом выше максимума
• Паттерны пробоя: - Если свеча 1H пробивает предыдущий максимум до закрытия (таймер активен), ожидайте продолжения бычьего тренда
Сводка
Users can toggle individual higher timeframe candle blocks on or off and adjust the number of visible candles per timeframe (1 to 10). This facilitates monitoring of key levels and trend directions across multiple timeframes simultaneously. Practical use cases include anticipating candle closings, detecting live trend reversals, and identifying confluence entries based on support, resistance, and candle color changes.
Due to platform visual constraints, manual zoom and scroll are currently required for optimal viewing, especially on timeframes below 1 hour. Planned updates will introduce horizontal scrolling to enable historical pattern analysis, comparison of current versus past structures, and identification of key zones on higher timeframes.
HTF Candles supports traders in aligning trades with higher timeframe trends and enhances multi-timeframe market analysis within a single chart view.