ADX IMPROVED
อินดิเคเตอร์
เวอร์ชัน 1.0, Aug 2025
Windows, Mac
คำอธิบาย
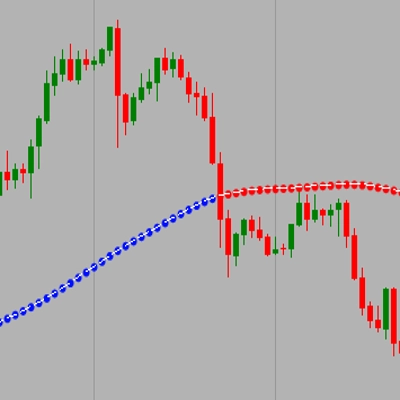
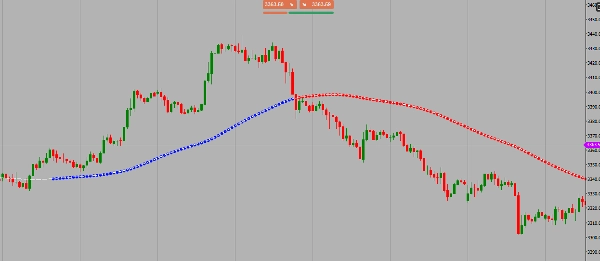
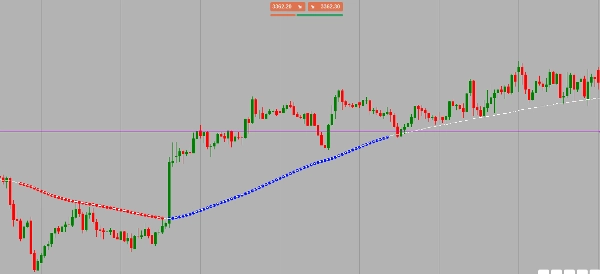
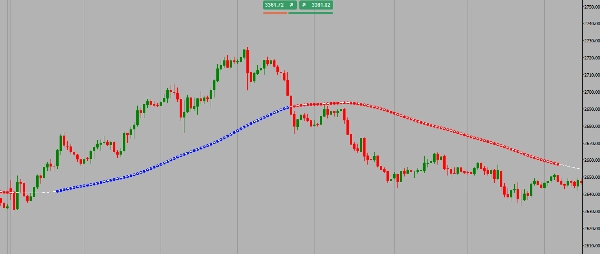
The SmartADXWMAIndicator เป็นเครื่องมือกำหนดเองที่หลากหลายสำหรับการวิเคราะห์ทางเทคนิค มันรวมสององค์ประกอบหลักเพื่อช่วยให้นักเทรดระบุและติดตามแนวโน้มตลาด:
- เส้นแนวโน้มที่เรียบเนียน: ตัวบ่งชี้คำนวณ ค่าเฉลี่ยเคลื่อนที่ถ่วงน้ำหนัก (WMA) ของราคาปิด จากนั้นจะใช้ ค่าเฉลี่ยเคลื่อนที่เลขชี้กำลัง (EMA) กับ WMA นั้น สร้างเส้นเดียวที่เรียบเนียนบนกราฟ เส้นนี้ถูกออกแบบมาให้ตอบสนองต่อการเคลื่อนไหวราคาล่าสุดได้ดีในขณะที่ยังกรองความผันผวนเล็กน้อยออกไป ทำให้คุณเห็นภาพชัดเจนของทิศทางแนวโน้มปัจจุบัน
- จุดสัญญาณสำหรับยืนยันแนวโน้ม: มันใช้ ดัชนีทิศทางเฉลี่ย (ADX) ซึ่งเป็นตัวบ่งชี้โมเมนตัมขั้นสูง เพื่อยืนยันความแข็งแกร่งของแนวโน้ม เมื่อค่า ADX สูงกว่าค่าที่ผู้ใช้กำหนดไว้ จะเป็นสัญญาณว่าตลาดอยู่ในแนวโน้มที่แข็งแกร่งและต่อเนื่อง
วิธีการทำงานร่วมกัน
พลังของตัวบ่งชี้อยู่ที่วิธีการรวมกัน มันไม่เพียงแค่แสดงเส้นแนวโน้มเท่านั้น แต่ยังให้สัญญาณภาพที่แม่นยำด้วย
- จุดสีเขียว ปรากฏตรงบนเส้นแนวโน้มเมื่อ ค่า ADX สูงกว่าค่าที่กำหนด และ ราคาสูงกว่าเส้นแนวโน้ม ยืนยันแนวโน้มขาขึ้นที่แข็งแกร่ง
- จุดสีแดง ปรากฏเมื่อ ค่า ADX สูงกว่าค่าที่กำหนด และ ราคาต่ำกว่าเส้นแนวโน้ม ยืนยันแนวโน้มขาลงที่แข็งแกร่ง
การรวมกันนี้ช่วยให้นักเทรดเห็นได้ง่ายเมื่อใดที่ตลาดกำลังมีแนวโน้ม ทิศทางที่มันเคลื่อนที่ และเมื่อใดที่อาจพิจารณาเข้าหรือออกจากการเทรดตามความสัมพันธ์ระหว่างราคาและเส้นแนวโน้ม
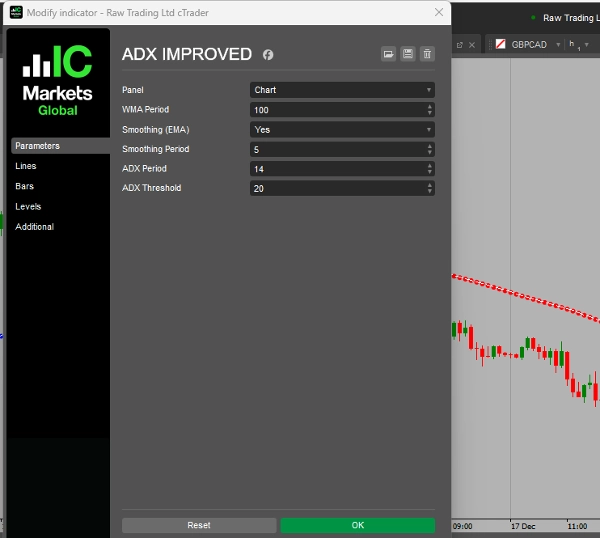
สำหรับการเทรดสวิง คุณสามารถลองใช้ wma 100 และค่ากำหนด 20 หรือ 25
สรุป
โปรไฟล์อินดิเคเตอร์
รีวิวจากลูกค้า
0.0
รีวิว: 0
รีวิวจากลูกค้า
ยังไม่มีรีวิวสำหรับผลิตภัณฑ์นี้ หากเคยลองแล้ว ขอเชิญมาเป็นคนแรกที่บอกคนอื่น!
การสนทนา
คำถามที่พบบ่อย
ผลิตภัณฑ์ที่มีให้บริการผ่าน cTrader Store รวมถึงบอทการเทรด อินดิเคเตอร์ และปลั๊กอิน มีให้บริการโดยนักพัฒนาบุคคลที่สามและมีไว้เพื่อวัตถุประสงค์ในการเข้าถึงข้อมูลและทางเทคนิคเท่านั้น cTrader Store ไม่ใช่โบรกเกอร์และไม่ได้ให้คำแนะนำการลงทุน คำแนะนำส่วนบุคคล หรือการรับประกันผลการดำเนินงานในอนาคต


ราคา
ตั้งแต่ 15/12/2024
3.6M
ปริมาณการเทรด
2.05M
Pips ที่ได้กำไร