
คำอธิบาย
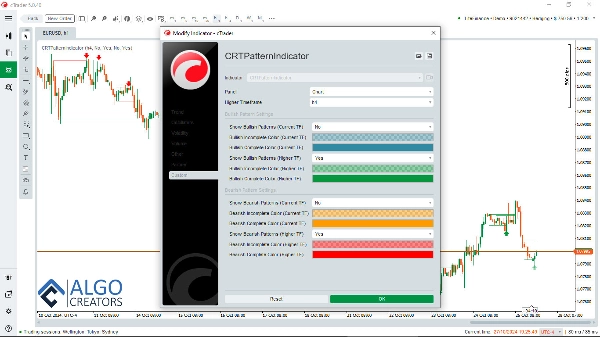
ตัวบ่งชี้ CRT (Candle Range Theory) เป็นเครื่องมือวิเคราะห์ที่ทรงพลังซึ่งออกแบบมาเฉพาะสำหรับเทรดเดอร์ที่ติดตามวิธีการ ICT (Inner Circle Trader) ตัวบ่งชี้นี้จะระบุรูปแบบแท่งเทียนที่สำคัญซึ่งเกี่ยวข้องกับ CRT ซึ่งมีความสำคัญต่อการเข้าใจการเคลื่อนไหวของตลาดและการเคลื่อนไหวของราคา
ตัวบ่งชี้ cTrader CRT มาพร้อมกับความสามารถหลายกรอบเวลา ช่วยให้เทรดเดอร์สามารถดูรูปแบบ CRT ของกรอบเวลาที่สูงกว่า (HTF) ในขณะที่ทำงานบนกรอบเวลาที่ต่ำกว่า (LTF) ฟังก์ชันนี้มีความสำคัญต่อการได้รับข้อมูลเชิงลึกเกี่ยวกับโครงสร้างตลาดโดยรวมและปรับปรุงการตัดสินใจในการเทรด
การเคลื่อนไหวของราคาและ ICT Power of 3 (AMD):
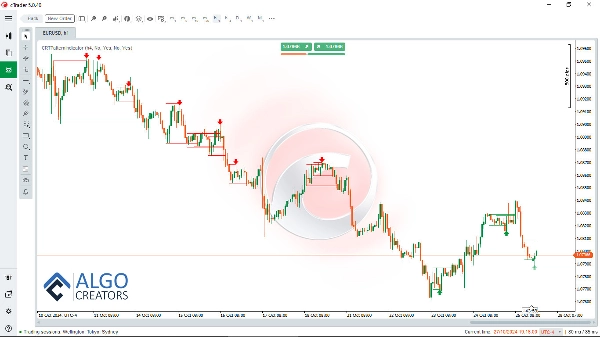
ตัวบ่งชี้ CRT ช่วยให้ง่ายต่อการวิเคราะห์การเคลื่อนไหวของราคาและการจดจำรูปแบบที่เกี่ยวข้องกับ Power of 3 ของ ICT (Anatomy of Market Dynamics - AMD)
LTF CRT ภายใน HTF CRT:
โดยการระบุจุดสำคัญของแนวรับและแนวต้านอย่างง่ายดาย เทรดเดอร์สามารถวิเคราะห์การเคลื่อนไหวของราคาได้อย่างชัดเจนมากขึ้น นอกจากนี้ ตัวบ่งชี้ CRT ยังเน้นรูปแบบ HTF และ LTF ช่วยให้เทรดเดอร์นำทางในไดนามิกของรอบตลาดต่างๆ ได้
ใช้ตัวบ่งชี้ CRT ร่วมกับแนวคิดการเทรดอื่นๆ:
การรวม CRT กับแนวคิดการเทรดอื่นๆ เช่น FVGs, order blocks และ turtle soup ช่วยเพิ่มโอกาสในการระบุการเทรดที่ประสบความสำเร็จ
นอกจากนี้ ตัวบ่งชี้ CRT ยังเป็นเครื่องมือเสริมที่มีคุณค่าสำหรับ Smart Money Assistant ตัวบ่งชี้ขั้นสูงที่ออกแบบมาเพื่อช่วยเทรดเดอร์ smart money ด้วยข้อมูลเชิงลึกและการตัดสินใจที่สำคัญในตลาด เมื่อรวมกัน ตัวบ่งชี้ทั้งสองนี้สร้างชุดเครื่องมือการเทรดที่ครบวงจรซึ่งช่วยเพิ่มความสามารถของเทรดเดอร์ในการวิเคราะห์และดำเนินการ
ดาวน์โหลด Smart Money Assistant: https://ctrader.com/algos/show/3956/
เพื่อเพิ่มกลยุทธ์การเทรดให้มากขึ้น FVG Finder ตัวบ่งชี้นี้สามารถใช้ควบคู่กับตัวบ่งชี้ CRT เครื่องมือนี้ตรวจจับช่องว่างมูลค่ายุติธรรม (Fair Value Gaps - FVGs) บนกราฟ ซึ่งเมื่อใช้ร่วมกับสัญญาณ CRT จะช่วยเพิ่มโอกาสในการทำการเทรดที่ประสบความสำเร็จ
ดาวน์โหลดตัวบ่งชี้ FVG finder: https://ctrader.com/algos/show/3877/
โดยการผสานตัวบ่งชี้เหล่านี้ เทรดเดอร์สามารถสร้างระบบที่แข็งแกร่งซึ่งใช้การตั้งค่าที่มีความน่าจะเป็นสูง ช่วยให้พวกเขานำทางตลาดได้อย่างมีประสิทธิภาพและเพิ่มประสิทธิภาพผลลัพธ์การเทรด
ดาวน์โหลดตัวบ่งชี้ CRT พร้อมการแจ้งเตือน:: www[dot]AlgoCreators[dot]net
ด้วย CRT, Smart Money Assistant และ FVG Finder ในชุดเครื่องมือของคุณ คุณสามารถเพิ่มความเข้าใจในแนวโน้มตลาดและปรับปรุงประสิทธิภาพการเทรดโดยรวม ทำให้เป็นทรัพยากรที่จำเป็นสำหรับเทรดเดอร์ที่ต้องการประสบความสำเร็จในสไตล์การเทรด ICT
สรุป
It simplifies the recognition of price movements related to ICT’s Power of 3 (Anatomy of Market Dynamics - AMD) and highlights critical support and resistance levels. By displaying both higher and lower timeframe patterns, it helps traders interpret market cycles more clearly.
The CRT indicator can be combined with other trading concepts such as Fair Value Gaps (FVGs), order blocks, and turtle soup patterns to enhance trade identification. It also complements the Smart Money Assistant indicator, providing a comprehensive toolkit for smart money trading analysis.
Additionally, pairing the CRT indicator with the FVG Finder, which detects Fair Value Gaps, can improve the probability of successful trades. Together, these tools support the development of robust trading strategies aligned with the ICT style.
รีวิวจากลูกค้า
5 | 85 % | |
4 | 15 % | |
3 | 0 % | |
2 | 0 % | |
1 | 0 % |


!["Smart Money Concepts (SMC) [Iridio Capital]" โลโก้](https://cdn.ctrader.com/image/webp/28b69fd1-ef54-4bed-9487-07e78e883be4_40934)


