
คำอธิบาย
ตัว Follow Line indicator เป็นตัวบ่งชี้ cTrader ที่ทรงพลังสำหรับการวิเคราะห์ทางเทคนิค ช่วยให้นักเทรดสามารถระบุจุดเข้าและออกที่เหมาะสมในตลาดการเงินได้ โดยการรวม Bollinger Bands และตัวบ่งชี้ ATR เข้าด้วยกัน จะช่วยกรองแนวโน้มและให้สัญญาณซื้อขายที่เชื่อถือได้
ด้วยตัวบ่งชี้นี้ คุณสามารถสังเกตแนวโน้มตลาดที่ขึ้นหรือลงได้อย่างง่ายดายและติดตามสัญญาณที่มีความมั่นใจสูง
นักเทรดสามารถรวม Follow Line Indicator กับเครื่องมือขั้นสูงเช่น Smart Money Assistant indicator ของ cTrader และออสซิลเลเตอร์เช่น MACD เพื่อเสริมการวิเคราะห์และยืนยันการเข้าทำรายการ
การตั้งค่าที่ปรับแต่งได้และการแจ้งเตือนแบบเรียลไทม์ทำให้เป็นส่วนเสริมที่มีคุณค่าสำหรับกลยุทธ์การเทรดใด ๆ ช่วยให้ผู้ใช้สามารถดำเนินการเทรดได้อย่างมั่นใจและแม่นยำ
คุณสมบัติหลัก:
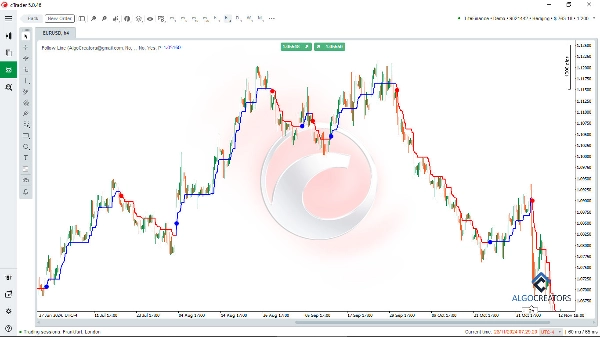
- การตรวจจับแนวโน้ม: ใช้ Follow Line เพื่อระบุแนวโน้มตลาดขาขึ้นหรือขาลง
- สัญญาณซื้อ/ขาย: แสดงสัญญาณซื้อและขายที่แม่นยำตามการเบรคเอาท์ของ Bollinger Bands
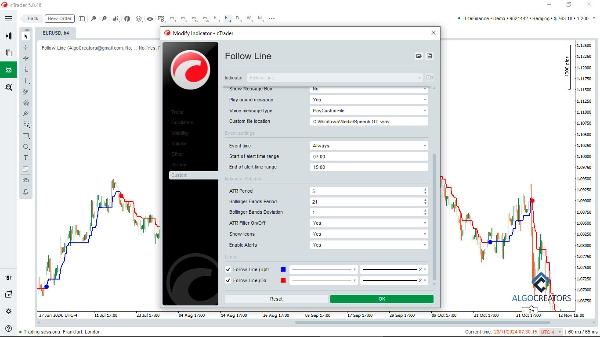
- ตัวกรอง ATR: ตัวเลือกเปิดหรือปิดตัวกรอง ATR เพื่อเพิ่มความแม่นยำของสัญญาณ
- การตั้งค่าที่ปรับแต่งได้: ปรับช่วงเวลาของ Bollinger Bands, ส่วนเบี่ยงเบนมาตรฐาน และช่วงเวลาของ ATR
- การแสดงผลภาพ: แสดงสัญญาณบนชาร์ตโดยใช้ไอคอนที่เข้าใจง่าย (ลูกศรหรือเส้น)
- การแจ้งเตือน: รับการแจ้งเตือนทันทีเมื่อมีสัญญาณซื้อหรือขายปรากฏขึ้น
ตัวบ่งชี้นี้สามารถปรับแต่งได้สูง ช่วยให้นักเทรดปรับช่วงเวลาของ Bollinger Bands, ส่วนเบี่ยงเบนมาตรฐาน และการตั้งค่า ATR ให้เหมาะสมกับกลยุทธ์ของตน สัญญาณภาพและการแจ้งเตือนทันทีทำให้ใช้งานง่ายและมีประสิทธิภาพทั้งสำหรับการเทรดแบบสแคปปิ้งและสวิงเทรด ด้วยคุณสมบัติเช่น การตรวจจับแนวโน้ม การจัดการความเสี่ยง และการตั้งค่าที่ปรับแต่งได้ Follow Line Indicator เหมาะสำหรับนักเทรดฟอเร็กซ์ สกุลเงินดิจิทัล และหุ้นที่ต้องการพัฒนาการวิเคราะห์ทางเทคนิคและประสิทธิภาพการเทรดของตน
เหมาะสำหรับการระบุโอกาสในตลาดอย่างแม่นยำ!
สรุป
Users can customize settings such as Bollinger Bands period, standard deviation, and ATR period to align with their trading strategies. The indicator visually represents signals on the chart using intuitive icons like arrows or lines and provides real-time alerts when signals occur. It supports various trading styles, including scalping and swing trading, and is suitable for forex, cryptocurrency, and stock markets.
The Follow Line indicator can be combined with other tools like the cTrader Smart Money Assistant and MACD oscillators to confirm trade entries and enhance analysis. Its customizable features and alert system assist traders in identifying precise market opportunities and managing risk effectively.
รีวิวจากลูกค้า
5 | 60 % | |
4 | 20 % | |
3 | 20 % | |
2 | 0 % | |
1 | 0 % |


