Description
Taiz Pro Volume Profile : L'outil d'analyse ultime pour révéler les intentions du marché
Êtes-vous fatigué de dépendre d'indicateurs retardés qui ne vous donnent pas une image complète ? L'indicateur Taiz Pro Volume Profile n'est pas un simple outil supplémentaire, c'est votre fenêtre pour voir ce qui se passe "dans les coulisses" du marché.
Contrairement aux indicateurs de volume traditionnels qui montrent "quand" une transaction a eu lieu, cet indicateur révèle "où" la transaction a eu lieu, vous offrant un véritable avantage concurrentiel.
---
· Que vous offre cet indicateur ?
o 📈 Identification des zones de forte liquidité : Découvrez les niveaux de prix où les volumes de transactions sont les plus concentrés. Ce sont les zones défendues par les faiseurs de marché et les grandes institutions.
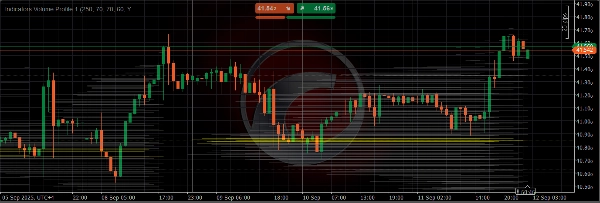
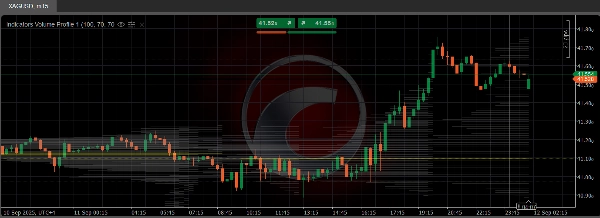
o 🎯 Point de contrôle (Point of Control - POC) :* L'indicateur vous montre clairement (en ligne jaune) le niveau de prix où le plus grand volume de transactions a eu lieu. Ce niveau agit comme un aimant pour le prix et constitue une zone de support ou de résistance très importante.
o 📊 Zone de valeur (Value Area - VA) : Il détermine la plage de prix (en gris) où 70 % des transactions ont eu lieu. Trader au-dessus de cette zone est un signal haussier fort, tandis que trader en dessous est un signal baissier.
o 💡 Décisions de trading plus intelligentes : Utilisez ces zones pour identifier avec précision les points d'entrée, placer des ordres stop-loss en toute sécurité et définir des objectifs réalistes de prise de profit.
---
· Pourquoi cet indicateur est-il meilleur ?
o Précision de calcul exceptionnelle : Il utilise un algorithme avancé pour répartir le volume avec précision sur chaque mouvement de prix, offrant un résultat plus réaliste.
o Facilité d'utilisation : Interface simple et paramètres clairs vous permettant de personnaliser l'indicateur selon votre style d'analyse.
o Performance stable : Le code a été conçu pour être léger et stable, garantissant de ne pas ralentir votre plateforme cTrader.
Élevez votre analyse technique au niveau supérieur. Commencez à trader sur la base de données réelles, pas seulement de suppositions. Téléchargez l'indicateur maintenant.
Résumé
Key features include:
- High liquidity zones: Identifies price levels with the largest traded volumes, often defended by market makers and institutions.
- Point of Control (POC): Marks the price level with the highest volume using a yellow line, serving as a critical support or resistance area.
- Value Area (VA): Displays the price range where 70% of trading volume occurred, shaded in gray; trading above this area suggests bullish momentum, while below indicates bearish signals.
- Precision trading decisions: Helps users pinpoint entry points, set stop-loss orders safely, and establish realistic profit targets.
The indicator employs an advanced algorithm for accurate volume distribution across price movements, ensuring realistic results. It features a user-friendly interface with customizable settings and is optimized for stable, lightweight performance on the cTrader platform.
Applicable markets include Forex, indices, commodities, stocks, and cryptocurrencies, supporting symbols like EURUSD, GBPUSD, XAUUSD, BTCUSD, NAS100, and others. This tool aids traders in making data-driven decisions based on volume profile analysis.
Avis clients
5 | 0 % | |
4 | 100 % | |
3 | 0 % | |
2 | 0 % | |
1 | 0 % |


