![Trading product for [Stellar Strategies] BOS Trend 1.0 อินดิเคเตอร์, image 1](https://cdn.ctrader.com/image/webp/6cdec0f1-0e97-4a82-a8a4-2b67aed54d38_25695)
[Stellar Strategies] BOS Trend 1.0
อินดิเคเตอร์
455 ดาวน์โหลด
เวอร์ชัน 1.0, Nov 2024
Windows, Mac
5.0
รีวิว: 1
![Trading product for [Stellar Strategies] BOS Trend 1.0 อินดิเคเตอร์, image 2](https://cdn.ctrader.com/image/webp/2738d263-76dc-4e6f-a818-7e66349e6883_25696)
![Trading product for [Stellar Strategies] BOS Trend 1.0 อินดิเคเตอร์, image 3](https://cdn.ctrader.com/image/webp/5338cc95-bf3e-4db4-b575-3e935cff8e90_25697)
![Trading product for [Stellar Strategies] BOS Trend 1.0 อินดิเคเตอร์, image 4](https://cdn.ctrader.com/image/webp/59502053-3cfb-4232-b1da-c27ad8852e60_25698)
![Trading product for [Stellar Strategies] BOS Trend 1.0 อินดิเคเตอร์, image 5](https://cdn.ctrader.com/image/webp/e32ea74f-662d-4c30-8571-3b8062b6be90_25699)
![Trading product for [Stellar Strategies] BOS Trend 1.0 อินดิเคเตอร์, image 6](https://cdn.ctrader.com/image/webp/fe0c3dd9-19fe-4833-bd0e-640ccec47e31_25700)
![Trading product for [Stellar Strategies] BOS Trend 1.0 อินดิเคเตอร์, image 7](https://cdn.ctrader.com/image/webp/0fa38032-d41c-4684-a0ec-c9512db0d567_25701)
![Trading product for [Stellar Strategies] BOS Trend 1.0 อินดิเคเตอร์, image 8](https://cdn.ctrader.com/image/webp/10e865d7-9813-4932-ac9b-3b76516518c9_25702)
คำอธิบาย
[Stellar Strategies] BOS Trend เป็นตัวบ่งชี้ Break of Structure (BOS) แบบพรีเมียมหลายกรอบเวลาที่ออกแบบมาสำหรับ cAlgo ซึ่งให้ข้อมูลเชิงลึกที่สำคัญแก่ผู้ค้าเกี่ยวกับแนวโน้มตลาดโดยการตรวจจับ BOS ขาขึ้นและขาลงในหลายกรอบเวลา
คุณสมบัติ:
- การวิเคราะห์หลายกรอบเวลา: วิเคราะห์การเคลื่อนไหวของราคาในหลายกรอบเวลา (1 นาที ถึง รายวัน)
- กรอบเวลาที่ปรับแต่งได้: เปิดหรือปิดใช้งานกรอบเวลาที่เฉพาะเจาะจงเพื่อปรับแต่งการวิเคราะห์ของคุณ
- การแจ้งเตือนแบบเรียลไทม์: แสดงข้อความบนแผนภูมิเมื่อพบ BOS
- อินเทอร์เฟซที่ใช้งานง่าย: สีข้อความที่ปรับแต่งได้เพื่อการมองเห็นที่ดีขึ้นบนพื้นหลังแผนภูมิที่แตกต่างกัน
พารามิเตอร์:
- ช่วงเวลาย้อนกลับ (ค่าเริ่มต้น: 20): จำนวนแท่งที่ย้อนกลับไปเมื่อทำการตรวจจับ BOS
- พารามิเตอร์กรอบเวลา:
-
ใช้กรอบเวลา 1 นาทีใช้กรอบเวลา 5 นาทีใช้กรอบเวลา 15 นาทีใช้กรอบเวลา 30 นาทีใช้กรอบเวลา 1 ชั่วโมงใช้กรอบเวลา 4 ชั่วโมงใช้กรอบเวลารายวัน
- สีข้อความ (ค่าเริ่มต้น: "Yellow"): กำหนดสีสำหรับข้อความ BOS
วิธีใช้ตัวบ่งชี้:
- การเพิ่มตัวบ่งชี้:
-
- เปิดแพลตฟอร์ม cAlgo ของคุณ
- ไปที่ส่วนตัวบ่งชี้และเพิ่ม [Stellar Strategies] BOS Trend ลงในแผนภูมิของคุณ
- การตั้งค่าพารามิเตอร์:
-
- ช่วงเวลาย้อนกลับ: ปรับช่วงเวลาย้อนกลับตามกลยุทธ์การเทรดของคุณ (ค่าเริ่มต้นคือ 20 แท่ง)
- เปิด/ปิดใช้งานกรอบเวลา: เลือกกรอบเวลาที่คุณต้องการวิเคราะห์โดยการติ๊กหรือไม่ติ๊กตัวเลือกที่เกี่ยวข้อง
- สีข้อความ: เลือกสีข้อความที่มีความแตกต่างกับพื้นหลังแผนภูมิของคุณเพื่อการมองเห็นที่ชัดเจน
- การอ่านสัญญาณ BOS:
-
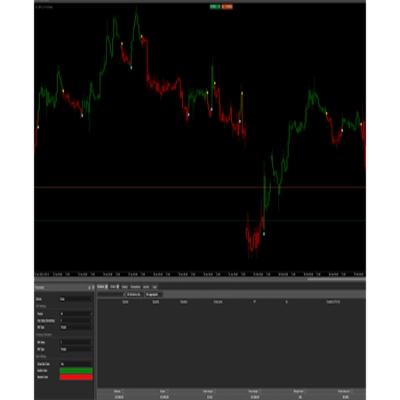
- BOS ขาขึ้น: เส้นสีเขียวแสดงถึงการเบรกโครงสร้างขาขึ้น
- BOS ขาลง: เส้นสีแดงแสดงถึงการเบรกโครงสร้างขาลง
- ข้อความ BOS: ข้อความเช่น "Current TF: Uptrend BOS detected" จะปรากฏบนแผนภูมิ พร้อมกับข้อความอื่น ๆ จากกรอบเวลาต่าง ๆ ที่คุณเปิดใช้งาน
- การตีความข้อมูล:
-
- ใช้สัญญาณ BOS เพื่อระบุการกลับตัวหรือการต่อเนื่องของแนวโน้มที่เป็นไปได้
- ให้ความสนใจกับการวิเคราะห์หลายกรอบเวลาเพื่อการยืนยันแนวโน้มที่แข็งแกร่งขึ้น
- การปรับแต่งการแสดงผล:
-
- คุณสามารถปรับสีข้อความและตำแหน่งของข้อความ BOS เพื่อการอ่านที่ดีขึ้น
ตัวอย่าง:
นี่คือตัวอย่างทีละขั้นตอนของวิธีใช้ [Stellar Strategies] BOS Trend ตัวบ่งชี้:
- เพิ่มตัวบ่งชี้:
-
- เปิดแผนภูมิในแพลตฟอร์ม cAlgo ของคุณ
- ไปที่
Indicatorsและเลือก [Stellar Strategies] BOS Trend.
- ตั้งค่าพารามิเตอร์:
-
- ตั้งค่า
Lookback Periodเป็น 20 - เปิดใช้งาน
Use 1 Minute Time Frame,Use 5 Minute Time Frameและกรอบเวลาอื่น ๆ ตามที่ต้องการ - ตั้งค่า
Text Colorเป็น "Yellow" เพื่อการมองเห็นที่ดีขึ้น
- ตั้งค่า
- ติดตามแผนภูมิ:
-
- สังเกตเส้น BOS สีเขียว (ขาขึ้น) และสีแดง (ขาลง) บนแผนภูมิของคุณ
- มองหาข้อความที่บ่งชี้การตรวจจับ BOS ในกรอบเวลาต่าง ๆ
- ดำเนินการ:
-
- ใช้สัญญาณ BOS เพื่อทำการตัดสินใจเทรดอย่างมีข้อมูลโดยอิงจากการกลับตัวหรือการต่อเนื่องของแนวโน้ม
โดยการทำตามขั้นตอนเหล่านี้ คุณสามารถใช้ประโยชน์จาก [Stellar Strategies] BOS Trend ตัวบ่งชี้เพื่อเพิ่มประสิทธิภาพกลยุทธ์การเทรดของคุณด้วยการวิเคราะห์ BOS หลายกรอบเวลา
หากต้องการความช่วยเหลือเพิ่มเติมหรือข้อมูลเพิ่มเติม โปรดแจ้งให้ฉันทราบ! 📈📉
สรุป
สรุปโดย AI
The [Stellar Strategies] BOS Trend is a multi-timeframe Break of Structure (BOS) indicator designed for the cAlgo platform. It identifies key market trend shifts by detecting uptrend and downtrend BOS signals across multiple timeframes ranging from 1 minute to daily charts. Users can customize which timeframes to analyze and adjust the lookback period for BOS detection, with a default of 20 bars. The indicator provides real-time alerts directly on the chart, displaying messages such as "Current TF: Uptrend BOS detected" to inform traders of structural breaks. Visual cues include green lines for uptrend BOS and red lines for downtrend BOS. The interface allows customization of text color to enhance visibility against different chart backgrounds. Traders can use the BOS signals to identify potential trend reversals or continuations, leveraging multi-timeframe analysis for stronger confirmation. The indicator supports flexible configuration to fit various trading strategies and preferences.
โปรไฟล์อินดิเคเตอร์
รีวิวจากลูกค้า
5.0
รีวิว: 1
5 | 100 % | |
4 | 0 % | |
3 | 0 % | |
2 | 0 % | |
1 | 0 % |
รีวิวจากลูกค้า
August 18, 2025
Pros: Automatically detects and marks Break Of Structure points indicating trend shifts. Clean visual arrows and straightforward setup. Cons: No alerts, tooltips, or template saving. May produce noise without volume or market context filters.
การสนทนา
คำถามที่พบบ่อย
ผลิตภัณฑ์ที่มีให้บริการผ่าน cTrader Store รวมถึงบอทการเทรด อินดิเคเตอร์ และปลั๊กอิน มีให้บริการโดยนักพัฒนาบุคคลที่สามและมีไว้เพื่อวัตถุประสงค์ในการเข้าถึงข้อมูลและทางเทคนิคเท่านั้น cTrader Store ไม่ใช่โบรกเกอร์และไม่ได้ให้คำแนะนำการลงทุน คำแนะนำส่วนบุคคล หรือการรับประกันผลการดำเนินงานในอนาคต
เพิ่มเติมจากผู้เขียนคนนี้
!["[Stellar Strategies] Market Structure Breakout" โลโก้](https://cdn.ctrader.com/image/webp/bceec265-3247-4b11-915f-6295a29c106d_28465)
!["[Stellar Strategies] Market Session Ultimate" โลโก้](https://cdn.ctrader.com/image/webp/61ffd537-0125-4246-9e72-42eca1791d64_28232)
!["[Stellar Strategies] Wave Trend Pro" โลโก้](https://cdn.ctrader.com/image/webp/5f226fbb-245a-41cd-9cdd-b018257d5e6d_28617)
!["[Stellar Strategies] Inside Bar with Signals" โลโก้](https://cdn.ctrader.com/image/webp/1d9e8bfa-3b2c-4440-bb37-5856902008a7_30683)
!["[Stellar Strategies] Linear Regression Candles 1.1" โลโก้](https://cdn.ctrader.com/image/webp/8b9cff9f-2431-46d2-b0ec-c7f55f4a4a6d_27918)
!["[Stellar Strategies] Smart ADX" โลโก้](https://cdn.ctrader.com/image/webp/af13b084-b6f6-41db-b7bc-c7e688b57b05_36929)
!["[StellarStrategies] Scheduled Trade Executor" โลโก้](https://cdn.ctrader.com/image/webp/daefc6af-7eca-453e-878d-1b981be2c401_25646)
!["[Stellar Strategies] VBO" โลโก้](https://cdn.ctrader.com/image/webp/f034c012-94d4-445a-a01b-febd1cdedaef_36944)
!["[Stellar Strategies] SP500 Gap Closure cBot 1.0" โลโก้](https://cdn.ctrader.com/image/webp/92c23fdc-4ad1-4e61-bdb5-c77f6ec8c539_27686)
!["[Stellar Strategies] Candlestick Patterns Dashboard" โลโก้](https://cdn.ctrader.com/image/webp/ae8691a5-4884-4553-9bcc-64e16ac82a30_38344)
!["[Stellar Strategies] QQE" โลโก้](https://cdn.ctrader.com/image/webp/e702104a-874c-4b39-97dd-fb34518d1015_27712)
!["[Stellar Strategies] Visual Trend Momentum" โลโก้](https://cdn.ctrader.com/image/webp/48aee0a5-f10e-4bc8-9671-78e156fcc5df_27548)


!["[Hamster-Coder] Pivot Points MTF" โลโก้](https://cdn.ctrader.com/image/webp/4c143e5a-309c-40e3-a578-f04d1e133ffa_31159)

ราคา
20.46M
ปริมาณการเทรด
8K
Pips ที่ได้กำไร
25
การขาย
4.34K
ติดตั้งฟรี