Opis
# SmartFractalZigZag - The Foundation for Every Trading Methodology
## Product Overview
**SmartFractalZigZag** is not just another indicator — it's the **structural foundation** that every serious trading methodology depends on.
Whether you practice **Smart Money Concepts (SMC/ICT)**, **Elliott Wave Theory**, **Dow Theory**, **Wyckoff Method**, **Chan Theory (缠论)**, or any form of **price action analysis** — they all begin with one fundamental requirement: **accurately identifying market structure**.
This indicator gives you that foundation with **zero repainting**, **customizable sensitivity**, and **clean visual output**.
---
## The Universal Foundation: Why Structure Matters
Every major trading methodology is built on the same building blocks:
| Methodology | What They Call It | What SmartFractalZigZag Shows |
|-------------|-------------------|-------------------------------|
| **Support/Resistance** | Key Levels | Swing highs = resistance, swing lows = support |
| **SMC/ICT** | Swing High/Low, BOS, CHoCH | Exact swing points for structure breaks |
| **Elliott Wave** | Wave Pivots | Clear pivot points for wave counting |
| **Dow Theory** | Higher Highs/Lows | Trend structure at a glance |
| **Wyckoff** | Springs, Upthrusts | Swing extremes in accumulation/distribution |
| **Chan Theory (缠论)** | 笔 (Bi), 线段 | Customizable structure for 笔 identification |
| **Fibonacci** | Anchor Points | Precise swing points for retracement/extension |
| **Price Action** | Swing Structure | Clean market rhythm visualization |
**One indicator. Every methodology. Solid foundation.**
---
## Trading Methodology Applications
### Smart Money Concepts (SMC) / ICT
- **Break of Structure (BOS)**: When price breaks a swing high/low, structure shifts
- **Change of Character (CHoCH)**: First opposite break signals potential reversal
- **Order Block Analysis**: Swing points define where to look for OBs
- **Premium/Discount Zones**: Use swing range for zone calculation
**Tip**: Use Left=5, Right=3 for intraday SMC structure; Left=10, Right=5 for higher timeframe analysis.
### Elliott Wave Theory
- **Wave Pivots**: Each fractal marks a potential wave start/end point
- **Impulse Waves**: 5-wave structure clearly visible through swing sequence
- **Corrective Waves**: ABC patterns emerge from alternating swings
- **Wave Degree**: Adjust Left/Right bars to see different wave degrees
**Tip**: Run multiple instances — one for minor waves (3/2), one for intermediate (10/5), one for primary (20/10).
### Dow Theory
- **Uptrend Confirmation**: Series of higher highs AND higher lows
- **Downtrend Confirmation**: Series of lower highs AND lower lows
- **Trend Reversal Warning**: When the sequence breaks
- **Primary/Secondary Trends**: Different sensitivity settings reveal different trend levels
**Tip**: Use Left=10, Right=5 for primary trends; Left=5, Right=3 for secondary/intermediate trends.
### Wyckoff Method
- **Accumulation Phases**: Identify swing lows forming support
- **Distribution Phases**: Identify swing highs forming resistance
- **Springs & Upthrusts**: Extreme swings that fail and reverse
- **Trading Range Analysis**: Clear boundaries from swing extremes
**Tip**: Use higher sensitivity (Left=5, Right=3) to catch springs/upthrusts; lower sensitivity (Left=10, Right=5) to define trading range boundaries.
### Chan Theory (缠论)
- **笔 (Bi) Identification**: Adjust sensitivity to match your 笔 definition
- **线段 (Line Segment)**: Higher sensitivity for 线段 structure
- **中枢 (Zhongshu)**: Overlapping swing ranges define consolidation zones
- **背驰 (Divergence)**: Compare swing magnitudes for divergence analysis
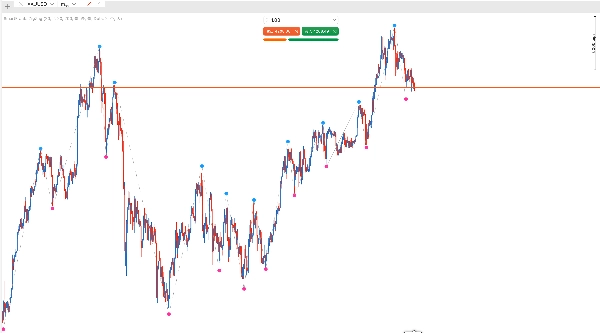
### Support & Resistance — The Most Direct Application
This is the **simplest yet most powerful** use case — no complex theory required.
**Every fractal is a potential S/R level:**
- **Up Fractals (Swing Highs)** = Resistance levels where sellers stepped in
- **Down Fractals (Swing Lows)** = Support levels where buyers stepped in
- **Tested Multiple Times** = Stronger, more significant levels
- **Broken Levels** = Old resistance becomes new support (and vice versa)
**Practical Usage:**
- Draw horizontal lines from fractal points to extend S/R into the future
- Watch for price reactions at these levels
- Combine with volume analysis for confirmation
- Use for stop-loss placement (below support / above resistance)
- Identify breakout/breakdown opportunities
**Tip**: Higher Left/Right values (e.g., 10/5 or 20/10) produce fewer but more significant S/R levels. Lower values show more granular levels for scalping.
### Fibonacci Analysis
Fractals provide the **anchor points** for Fibonacci measurements — no more guessing where to draw from.
**Retracements:**
- Swing High to Swing Low for downtrend retracements
- Swing Low to Swing High for uptrend retracements
- Key levels: 38.2%, 50%, 61.8%
**Extensions:**
- Use three consecutive fractals (A-B-C) for extension projections
- Target levels: 127.2%, 161.8%, 261.8%
**Practical Workflow:**
1. Identify two significant fractals (one high, one low)
2. Draw Fibonacci tool from one to the other
3. Watch for price reactions at Fib levels
4. Combine with other fractals for confluence
**Tip**: Use higher Left/Right values (10/5 or above) to identify major swings for Fibonacci analysis. Minor swings create too many levels.
---
## Quick Start Guide
**Step 1: Add to Chart**
- Find SmartFractalZigZag in Indicators
- Drag onto your chart
**Step 2: Choose Your Style**
| Your Style | Left Bars | Right Bars | What You'll See |
|------------|-----------|------------|-----------------|
| Scalper | 3 | 2 | Many small swings |
| Day Trader | 5 | 3 | Intraday structure |
| Swing Trader | 10 | 5 | Major swings (default) |
| Position Trader | 20 | 10 | Macro structure only |
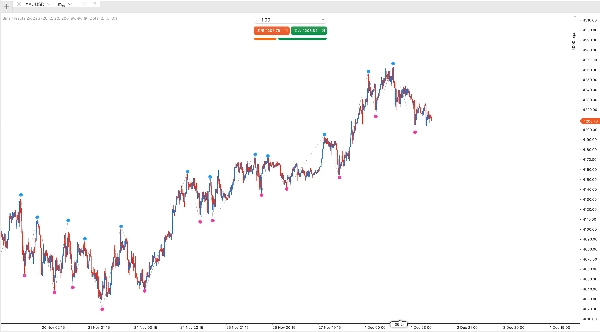
**Step 3: Interpret the Signals**
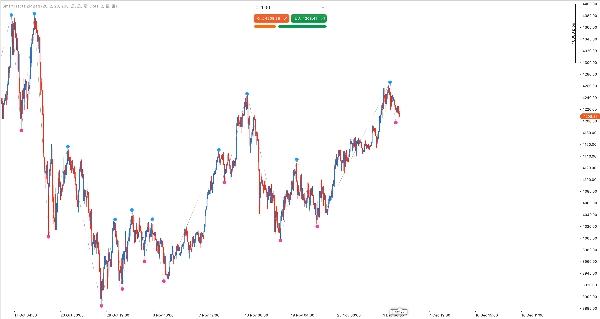
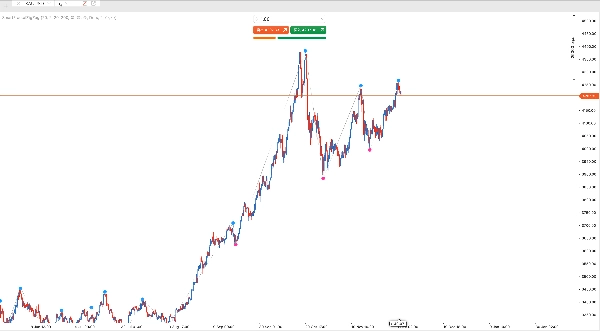
- **Blue dots above candles** = Swing Highs (potential resistance)
- **Pink dots below candles** = Swing Lows (potential support)
- **ZigZag lines** = Visual connection of swings
**Step 4: Apply to Your Trading**
- **S/R Trading**: Draw horizontal lines from fractal points
- **Trend Trading**: Look for higher highs/lows (uptrend) or lower highs/lows (downtrend)
- **Fibonacci**: Use fractals as anchor points for retracement/extension tools
- **Pattern Recognition**: Spot double tops, head & shoulders, etc.
**Pro Tips:**
- Run multiple instances with different settings to see both micro and macro structure
- Turn off ZigZag if you only need the fractal points
- Adjust Fractal Offset if dots overlap with candles
---
## Key Features
### 1. ZERO REPAINTING — The Non-Negotiable
**This is the most critical feature.**
90% of fractal/ZigZag indicators repaint. Signals appear, disappear, and move. Your backtests show "perfect" entries that never existed in real-time.
**SmartFractalZigZag Guarantee:**
- Fractals confirm ONLY after all right-side bars have closed
- Once drawn, a fractal NEVER changes position
- Historical signals are 100% reliable
- Backtest results = Live trading results
- Safe for cBot/automated trading integration
**Technical Principle**: A fractal at bar N is confirmed only when bar N+RightBars has fully closed. No exceptions.
### 2. Customizable Structure Sensitivity
**Left/Right Bars** control how "significant" a swing must be:
| Trading Style | Suggested Settings | Use Case |
|---------------|-------------------|----------|
| Scalping | Left=3, Right=2 | Micro-structure, quick reversals |
| Day Trading | Left=5, Right=3 | Intraday swings |
| Swing Trading | Left=10, Right=5 | Multi-day structure |
| Position Trading | Left=20, Right=10 | Major market structure |
**Multi-Instance Power**: Run 2-3 instances with different settings to see micro, meso, and macro structure simultaneously on one chart.
### 3. Smart Same-Direction Filtering — Eliminate Noise & False Signals
This is a **critical feature** that separates SmartFractalZigZag from ordinary fractal indicators.
**The Problem with Traditional Fractals:**
Traditional fractal indicators show EVERY qualifying fractal point. In trending markets, this creates:
- Multiple consecutive same-direction fractals (e.g., 5 up-fractals in a row during an uptrend)
- Visual clutter that obscures true market structure
- False signals — not every fractal is a meaningful reversal point
- ZigZag lines that jump erratically between minor swings
- Difficulty identifying genuine support/resistance levels
**SmartFractalZigZag Solution — Interval Extreme Filtering:**
The indicator intelligently filters same-direction fractals, keeping only the TRUE extreme:
- **Up Fractals**: Only the HIGHEST high among consecutive up-fractals is preserved
- **Down Fractals**: Only the LOWEST low among consecutive down-fractals is preserved
- **Strict Alternation**: Every up-fractal is followed by a down-fractal, and vice versa
- **Interval Extreme Guarantee**: Each preserved fractal represents the true extreme between two opposite-direction fractals
**Why This Matters:**
| Without Filtering | With Smart Filtering |
|-------------------|---------------------|
| Many dots, visual chaos | Clean, minimal dots |
| Every minor swing shown | Only significant swings |
| False S/R levels | Reliable S/R levels |
| Noisy ZigZag lines | Smooth, meaningful ZigZag |
| Hard to identify structure | Structure at a glance |
**Trading Benefits:**
1. **Cleaner Charts**: Focus on what matters, not noise
2. **Reliable S/R**: Every fractal is a genuine extreme, not a minor fluctuation
3. **Better Wave Counting**: Clear pivots for Elliott Wave analysis
4. **Accurate BOS/CHoCH**: True structure breaks, not false signals
5. **Trustworthy Fibonacci**: Anchor points that represent real swings
**Flexibility**: If you prefer to see ALL fractals (for specific analysis needs), simply turn Filter Consecutive OFF. But for most traders, the filtered view provides cleaner, more actionable signals.
**Result**: Fewer dots, clearer swings, trustworthy levels, and genuine market structure.
### 4. Fractal + ZigZag Integration
- **Fractal Points**: Mark exact swing highs and lows
- **ZigZag Lines**: Connect swings for visual flow
- **Offset Display**: Fractals float above/below candles without obscuring price
- **Independent Toggle**: Show fractals only, ZigZag only, or both
---
## Parameters
### Fractal Settings
- **Left Bars**: Number of bars to the left for comparison (default: 10)
- **Right Bars**: Number of bars to the right for confirmation (default: 5)
### Display Settings
- **Fractal Size**: Size of fractal dot (default: 20, range: 5-60)
- **Fractal Offset**: Distance from price in points (default: 50)
- **Up/Down Fractal Color**: Customizable colors
- **Show Fractals**: Toggle fractal display
### ZigZag Settings
- **Enable ZigZag**: Toggle ZigZag lines
- **ZigZag Color/Style/Thickness**: Full customization
### Filter Settings
- **Filter Consecutive**: Smart same-direction filtering (default: ON)
### Other Settings
- **Force Cleanup All Instances**: Clear all indicator objects on chart
---
## Why Choose SmartFractalZigZag?
1. **Methodology Agnostic**: Works with SMC, Elliott, Dow, Wyckoff, Chan Theory, and more
2. **Zero Repainting**: Build your analysis on truth, not fiction
3. **Customizable Sensitivity**: Match the indicator to YOUR trading style
4. **Multi-Instance Support**: See multiple structure levels simultaneously
5. **Clean Output**: Smart filtering removes noise, shows only what matters
6. **Professional Quality**: Robust code with comprehensive edge-case handling
7. **Automation Ready**: Reliable signals for cBot integration
---
### Clarification: Same-Direction Filtering and Visual Replacement
- Smart same-direction filtering keeps only the most extreme point among consecutive same-direction candidates (higher-highs for up, lower-lows for down).
- Until an opposite-direction fractal appears, a previously drawn same-direction point may be visually replaced by a more extreme one. This is intentional filtering, not future data leakage, and uses only fully closed bars.
- Want absolutely no visual replacement? Turn Filter Consecutive OFF to show every qualified fractal (more points, more noise).