
คำอธิบาย
⭐ MULTI‑TIMEFRAME SMC ZONE™ 🇫🇮
การทำแผนที่อุปทานและอุปสงค์สถาบันในห้ากรอบเวลา — โดยอัตโนมัติ
ผลิตภัณฑ์ระดับมืออาชีพ
Multi‑Timeframe SMC Zone Engine™ เป็นตัวบ่งชี้ Smart Money Concepts ที่สร้างขึ้นอย่างแม่นยำซึ่งตรวจจับ วาด และซิงโครไนซ์โซนอุปทานและอุปสงค์สถาบันในห้ากรอบเวลาหลัก — ทั้งหมดแบบเรียลไทม์โดยตรงบนแผนภูมิของคุณ
ออกแบบมาสำหรับเทรดเดอร์ที่พึ่งพาโครงสร้างตลาด พฤติกรรมสภาพคล่อง และรอยเท้าสถาบัน เครื่องมือนี้ช่วยขจัดความไม่แน่นอนและความไม่สม่ำเสมอของการทำเครื่องหมายโซนด้วยตนเอง ไม่ว่าคุณจะเทรดแบบวันต่อวันหรือสวิง Multi‑Timeframe SMC Zone Engine™ จะมอบแผนที่หลายชั้นที่สมบูรณ์ของจุดที่ตลาดมีแนวโน้มจะตอบสนองมากที่สุด
นี่ไม่ใช่แค่ตัวบ่งชี้
มันคือระบบสติปัญญา SMC หลายกรอบเวลา
ความสามารถหลัก
การตรวจจับโซนอุปทานและอุปสงค์โดยอัตโนมัติ
เครื่องยนต์จะสแกนแท่งเทียนล่าสุด X แท่ง (กำหนดโดยผู้ใช้) ในแต่ละกรอบเวลาและระบุ:
โซนอุปสงค์ (ความไม่สมดุลแบบกระทิง)
โซนอุปทาน (ความไม่สมดุลแบบหมี)
โซนได้รับการยืนยันโดยใช้โครงสร้างแท่งเทียน — เพื่อให้แน่ใจว่าจะแสดงเฉพาะรอยเท้าสถาบันที่มีความหมายเท่านั้น
ห้ากรอบเวลา หนึ่งแผนภูมิ
ตัวบ่งชี้วิเคราะห์พร้อมกัน
รายวัน
4 ชั่วโมง
1 ชั่วโมง
30 นาที
15 นาที
แต่ละกรอบเวลาจะถูกกำหนดสีเฉพาะตัว ให้คุณเห็นภาพที่ชัดเจนและมีชั้นของความแข็งแกร่งในกรอบเวลาที่สูงกว่าและความแม่นยำในกรอบเวลาที่ต่ำกว่า
การผสานหลายกรอบเวลานี้คือสิ่งที่เทรดเดอร์ SMC ใช้เพื่อคาดการณ์การกวาดสภาพคล่อง บล็อกการบรรเทา และโซนพรีเมียม/ส่วนลด
การฉายโซนแบบไดนามิก
ทุกโซนจะถูกขยายโดยอัตโนมัติไปยังแท่งเทียนล่าสุด ทำให้คุณเห็น:
จุดที่ราคามีแนวโน้มจะตอบสนอง
โซนใดที่ยังคงใช้งานอยู่
ราคาปัจจุบันมีปฏิสัมพันธ์กับรอยเท้าสถาบันอย่างไร
ไม่มีการวาดซ้ำด้วยมือ ไม่มีความยุ่งเหยิง ไม่มีโซนล้าสมัย
ภาพมืออาชีพ
แต่ละโซนประกอบด้วย:
สี่เหลี่ยมสีที่มีความกว้างขอบปรับได้
ป้ายข้อความที่ชัดเจน (“Demand: H1”, “Supply: M15” เป็นต้น)
การวางตำแหน่งเลื่อนซ้ายอย่างชาญฉลาดเพื่อหลีกเลี่ยงการทับซ้อนกับแท่งเทียน
ผลลัพธ์คือแผนที่ SMC ที่สะอาด อ่านง่าย และระดับมืออาชีพ
ทำไมเทรดเดอร์ถึงชอบ
ขจัดการทำเครื่องหมายโซนด้วยตนเอง
ให้บริบทหลายกรอบเวลาได้ทันที
ช่วยระบุจุดตอบสนองที่มีความน่าจะเป็นสูง
ทำงานร่วมกับกลยุทธ์ใดก็ได้ที่อิงตาม SMC, ICT, Wyckoff หรือแนวคิดสภาพคล่อง
ภาพที่สะอาดไม่ทำให้แผนภูมิของคุณรก
เหมาะสำหรับทั้งนักเก็งกำไรระหว่างวันและเทรดเดอร์สวิง
เครื่องมือนี้ให้มุมมองของสถาบัน — โดยไม่ซับซ้อน
ตัวบ่งชี้นี้เหมาะสำหรับใคร
เทรดเดอร์ Smart Money Concepts
เทรดเดอร์สภาพคล่องสไตล์ ICT
เทรดเดอร์โครงสร้างตลาดและการไหลของคำสั่ง
นักเก็งกำไรที่ต้องการความแม่นยำ
เทรดเดอร์สวิงที่ต้องการบริบทกรอบเวลาที่สูงกว่า
ใครก็ตามที่ต้องการแผนที่อุปทาน/อุปสงค์ที่สะอาดและอัตโนมัติ
⭐ MULTI‑TIMEFRAME SMC ZONE™
เทรดด้วยความชัดเจนของรอยเท้าสถาบัน — ในทุกกรอบเวลาที่สำคัญ
หมายเหตุ
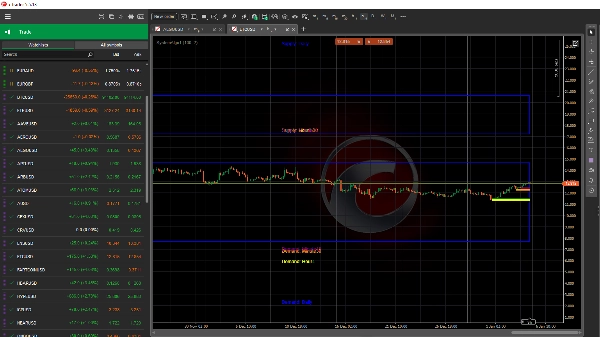
สีน้ำเงิน = อุปสงค์/อุปทานรายวัน
สีเขียว = อุปสงค์/อุปทาน 4 ชั่วโมง
สีเหลือง = อุปสงค์/อุปทาน 1 ชั่วโมง
สีม่วงเข้ม = อุปสงค์/อุปทาน 15 นาที
สีชมพู = อุปสงค์/อุปทาน 5 นาที
เมื่อทับซ้อนกัน > โอกาสสูงในการเทรดที่ประสบความสำเร็จ
สรุป
The indicator assigns unique colors to each timeframe’s zones for clear, layered visualization, enabling traders to assess higher-timeframe strength alongside lower-timeframe precision. Zones are dynamically extended to the latest candle, showing active areas where price is likely to react without manual redrawing or clutter.
Each zone is visually marked with a colored rectangle, adjustable border width, and clear text labels indicating timeframe and zone type, placed to avoid overlap with price candles. This tool supports trading strategies based on market structure, liquidity, and institutional footprints, including SMC, ICT, Wyckoff, and liquidity concepts.
SystemAlgo1 is suitable for intraday scalpers and swing traders seeking automated, multi-timeframe supply and demand mapping to identify high-probability reaction points across markets such as Forex, cryptocurrencies, indices, commodities, and stocks.

!["[Hamster-Coder] Pivot Points MTF" โลโก้](https://cdn.ctrader.com/image/webp/4c143e5a-309c-40e3-a578-f04d1e133ffa_31159)


!["[Stellar Strategies] MARSI Signal Plotter" โลโก้](https://cdn.ctrader.com/image/webp/7b2b8da6-8f8e-4646-8d4a-4710c516c01e_25567)