
present
ลงทะเบียนและรับส่วนลด $50 สำหรับการซื้อครั้งแรกของคุณ
Trading product for WeTrades Trend Rider EMA อินดิเคเตอร์ EMA Moving Average, image 1
WeTrades Trend Rider EMA
อินดิเคเตอร์
79 ดาวน์โหลด
เวอร์ชัน 1.0, May 2026
Windows, Mac
Trading product for WeTrades Trend Rider EMA อินดิเคเตอร์ EMA Moving Average, image 2
Trading product for WeTrades Trend Rider EMA อินดิเคเตอร์ EMA Moving Average, image 3
Trading product for WeTrades Trend Rider EMA อินดิเคเตอร์ EMA Moving Average, image 4
Trading product for WeTrades Trend Rider EMA อินดิเคเตอร์ EMA Moving Average, image 5
Trading product for WeTrades Trend Rider EMA อินดิเคเตอร์ EMA Moving Average, image 6
Trading product for WeTrades Trend Rider EMA อินดิเคเตอร์ EMA Moving Average, image 7
3.6K
ติดตั้งฟรี

คำอธิบาย

WeTrades Trend Rider EMA – สร้างขึ้นเพื่อหลีกเลี่ยงการเคลื่อนไหวปลอม

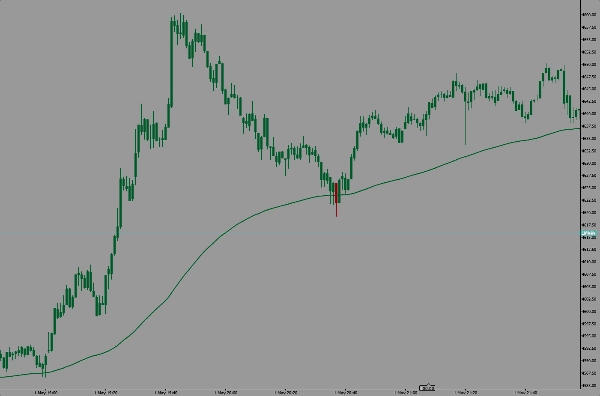
ในฐานะนักเทรดทอง หนึ่งในปัญหาที่ใหญ่ที่สุดที่ฉันเผชิญคือการถูกจับในแท่งเทียนเขียวปลอมในช่วงแนวโน้มขาลง

ราคาจะพิมพ์แท่งเทียนเขียวที่แข็งแกร่งอย่างกะทันหัน ดูเหมือนการกลับตัว และฉันก็เข้าเทรดเร็วเกินไป—แต่กลับเห็นแนวโน้มหลักดำเนินต่อไปในทางตรงกันข้ามกับฉัน

นั่นคือเหตุผลที่ฉันสร้าง WeTrades Trend Rider EMA ขึ้นมา

ตัวชี้วัดนี้ถูกออกแบบมาเพื่อให้คุณมุ่งเน้นที่แนวโน้มจริง ไม่ใช่เสียงรบกวนชั่วคราวของตลาด

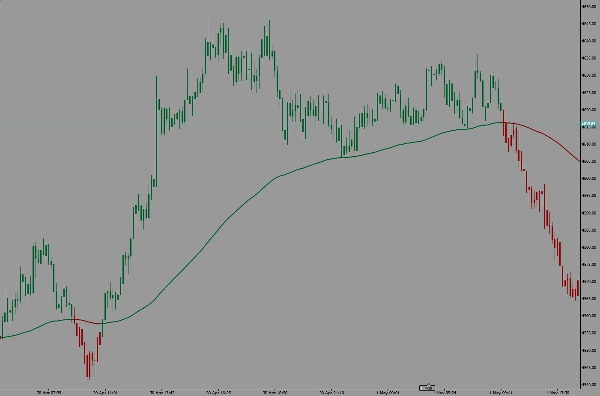
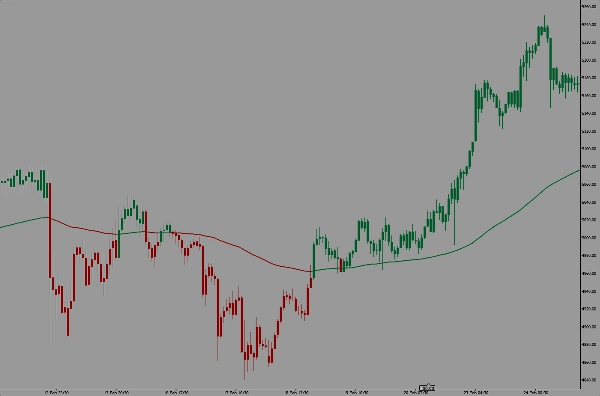
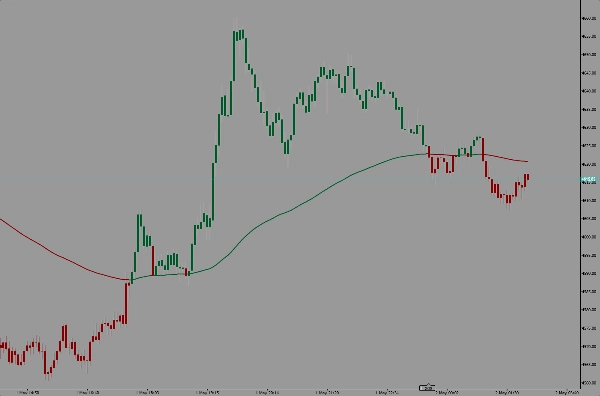
มันใช้ ค่าเฉลี่ยเคลื่อนที่แบบเอ็กซ์โพเนนเชียล (EMA) เป็นตัวกรองแนวโน้มและระบายสีแท่งเทียนตามตำแหน่งที่ราคาปิดเมื่อเทียบกับ EMA

วิธีการทำงาน

  • ถ้าราคาปิดเหนือ EMA → แท่งเทียนจะกลายเป็นขาขึ้น
  • ถ้าราคาปิดต่ำกว่า EMA → แท่งเทียนจะกลายเป็นขาลง
  • เส้น EMA เปลี่ยนแปลงตามตรรกะเดียวกันเพื่อยืนยันแนวโน้มที่ชัดเจน

เป้าหมายง่ายๆ คือ:

อย่าเทรดทุกแท่งเทียน เทรดตามแนวโน้ม

แท่งเทียนเขียวในแนวโน้มขาลงมักเป็นเพียงการพักตัว ไม่ใช่การกลับตัว

ตัวชี้วัดนี้ช่วยให้คุณระบุความแตกต่างนั้นได้เร็วขึ้น

เหตุผลที่ฉันใช้มัน

ในทอง การเคลื่อนไหวปลอมเกิดขึ้นอย่างรวดเร็ว
แท่งเทียนที่แข็งแกร่งสามารถหลอกให้นักเทรดคิดว่าโมเมนตัมเปลี่ยนไปแล้ว

ด้วย Trend Rider EMA ฉันสามารถเห็นได้อย่างรวดเร็วว่า:

✔ นี่คือการเปลี่ยนแนวโน้มจริงหรือไม่?
✔ นี่เป็นเพียงการพักตัวหรือไม่?
✔ ฉันกำลังเทรดตามโมเมนตัมหรือสวนทางกับมัน?

เหมาะสำหรับ

  • นักเทรดทอง
  • นักเก็งกำไรระยะสั้น
  • นักเทรดรายวัน
  • นักเทรดตามแนวโน้ม

กฎการเทรดของฉัน

แท่งเทียนเขียวเหนือ EMA = ความแข็งแกร่งของขาขึ้น
แท่งเทียนแดงต่ำกว่า EMA = ความแข็งแกร่งของขาลง

การยืนยันด้วยภาพที่ง่าย
ความลังเลน้อยลง
การหลอกลวงน้อยลง
วินัยในการเทรดตามแนวโน้มที่ดีขึ้น

สร้างจากประสบการณ์การเทรดจริง
สร้างขึ้นสำหรับนักเทรดที่ต้องการการอ่านแนวโน้มที่ชัดเจนขึ้นและการเข้าเทรดที่ผิดพลาดน้อยลง

สรุป

สรุปโดย AI
WeTrades Trend Rider EMA is a trading indicator designed to enhance trend identification by filtering out false market moves. It uses an Exponential Moving Average (EMA) as a trend filter and colors price candles based on their closing position relative to the EMA. Candles closing above the EMA are colored bullish, while those closing below are bearish. The EMA line itself adjusts accordingly to confirm trend direction visually.

This indicator aims to help traders focus on genuine trend shifts rather than temporary pullbacks or fake reversals, reducing premature entries against the main trend. It is particularly suited for gold traders, scalpers, intraday traders, and those employing trend-following strategies.

Key features include:
- Visual color-coded candles indicating bullish or bearish momentum relative to the EMA.
- EMA line that dynamically confirms trend direction.
- Simplified trend discipline by distinguishing real trend strength from market noise.

By providing clear visual cues, WeTrades Trend Rider EMA assists traders in making more informed decisions about trading with momentum and avoiding false signals.

โปรไฟล์อินดิเคเตอร์
หมวดหมู่อินดิเคเตอร์
Trend
ประเภทเอาต์พุต
การแสดงเป็นภาพ
ข้อกำหนดด้านข้อมูล
แท่งเท่านั้น
สัญญาณที่รองรับ
Breakout
Reversal
ความแข็งแกร่งของแนวโน้ม
เบรก Level ที่ระบุ
แตะ Level ที่ระบุ

รีวิวจากลูกค้า

0.0
รีวิว: 0
รีวิวจากลูกค้า
ยังไม่มีรีวิวสำหรับผลิตภัณฑ์นี้ หากเคยลองแล้ว ขอเชิญมาเป็นคนแรกที่บอกคนอื่น!

การสนทนา

คำถามที่พบบ่อย

EMA
Moving Average
ผลิตภัณฑ์ที่มีให้บริการผ่าน cTrader Store รวมถึงบอทการเทรด อินดิเคเตอร์ และปลั๊กอิน มีให้บริการโดยนักพัฒนาบุคคลที่สามและมีไว้เพื่อวัตถุประสงค์ในการเข้าถึงข้อมูลและทางเทคนิคเท่านั้น cTrader Store ไม่ใช่โบรกเกอร์และไม่ได้ให้คำแนะนำการลงทุน คำแนะนำส่วนบุคคล หรือการรับประกันผลการดำเนินงานในอนาคต

เพิ่มเติมจากผู้เขียนคนนี้

อินดิเคเตอร์
SMC
Prop
+14
Fair Value Gap (FVG)
อินดิเคเตอร์
ATR
Prop
+15
Smart trendline breakout indicator with auto signals, targets, and ATR-based zones for precise trade execution.
อินดิเคเตอร์
AI
SMC
+18
Smart Money Concepts (SMC)
อินดิเคเตอร์
MSS
Key Levels
+2
Marks liquidity zones at swing highs/lows, tracks touches, and confirms breaks to improve entries and structure clarity.
อินดิเคเตอร์
ATR
MSS
+5
Volume-based support and resistance boxes with breakout, hold, and structure shift signals for precise trading decisions
อินดิเคเตอร์
BOS
MSS
+3
identify Market Structure Breaks and Order Blocks to trade with confidence and avoid fake breakouts.
อินดิเคเตอร์
ATR
RSI
+15
Identifies high-probability breakout and retest zones using smart pivot structure and volatility filtering.
อินดิเคเตอร์
AI
SMC
+18
ICT First Presented FVG
อินดิเคเตอร์
SMC
Prop
+13
Smart Money traders, it extends key levels until mitigation, helping you track liquidity, structure
อินดิเคเตอร์
MSS
Key Levels
+4
Auto-detects support/resistance, draws clean levels, and confirms breakouts with volume and wick rejection signals.
อินดิเคเตอร์
ATR
BOS
+5
Smart SMC + Fibonacci engine with ATR filtering, dynamic levels, and precision entry signals.
cBot
Fixed Lot
Break Even
+2
Fast trade manager with hotkeys for break-even, partial closes, and instant exit control.

นอกจากนี้คุณยังอาจชอบ

อินดิเคเตอร์
Supply & Demand
Support & Resistance
Trade With Smile Indicator is a professional trading indicator designed to help traders identify potential market trends
อินดิเคเตอร์
Cumulative delta candles + volume profile
อินดิเคเตอร์
AI
Forex
+5
Dynamic, color‑coded candles reveal market shifts instantly—spot momentum and trend reversals at a glance
อินดิเคเตอร์
AI
ATR
+27
Trendlines That Adapt. Breakouts That Matter.
อินดิเคเตอร์
ADX
MACD
+3
Displays Boshi Chanlun Structure Indicator chart structures for supported Pepperstone cTrader symbols and timeframes.
อินดิเคเตอร์
Risk Dashboard
Drawdown Monitor
Which session is live right now, without doing the math?
อินดิเคเตอร์
SMC
Prop
+12
SMC Pro Suite: OBs, FVGs, Structure, Liquidity, Killzones & MTF overlay. Every concept in one cTrader indicator.
อินดิเคเตอร์
ATR
RSI
+4
RSI bands drawn on price, confluence-scored BUY/SELL signals, an ATR stop with three targets
"VWAP" โลโก้
ยอดนิยม
5.0
(3)
$50
/
$100
อินดิเคเตอร์
Track VWAP for Asia, London, NY, Sydney, Daily, Weekly, Monthly & Custom Sessions. Perfect for FX & intraday trading!
อินดิเคเตอร์
Forex
Detects valid Fair Value Gaps from strong 3-bar patterns. Keep drawing unfilled gaps until price fills them.
อินดิเคเตอร์
ADX
ATR
+5
Scored breakouts of sloped pivot trendlines: four filters on the break bar, ATR stop, 1:1 / 1:2 / 1:3 targets, alerts.
อินดิเคเตอร์
ATR
EMA
+2
Eight-EMA ribbon with ATR trade zones, a nine-symbol screener and a five-timeframe trend dashboard.
"Stochastic Momentum Index" โลโก้
เรตติ้งสูง
4.2
(4)
$19
/
$20
อินดิเคเตอร์
Prop
Forex
+14
Stochastic Momentum Index (SMI) for cTrader optional higher-timeframe source, and clear overbought/oversold levels.
อินดิเคเตอร์
Key Levels
Spots key hourly ranges and signals breakouts using arrows & colored background zones. Ideal for Gold.
อินดิเคเตอร์
EMA
RSI
+5
MACD Colour Histogram with 11 Moving Average Types, Multi-timeframe confirmation and Sound Signal Alert.
"Dynamic Swing Anchored VWAP" โลโก้
ยอดนิยม
4.6
(3)
$49
อินดิเคเตอร์
VWAP
Forex
+5
Dynamic Swing Anchored VWAP
"QX SessionBox ORB" โลโก้
ยอดนิยม
4.6
(3)
$22
/
$42
อินดิเคเตอร์
AI
ATR
+19
QX SessionBox ORB: Session boxes + ORB levels + clean dashboard with optional closed-candle breakout signals.
อินดิเคเตอร์
Prop
Forex
+11
⚡Nebula Range Filter is a professional trend filter indicator for cTrader⚡

ราคา

3.6K
ติดตั้งฟรี