
H Capital Liquidity Map Lite V1
อินดิเคเตอร์
252 ดาวน์โหลด
เวอร์ชัน 1.0, Mar 2026
Windows, Mac
คำอธิบาย
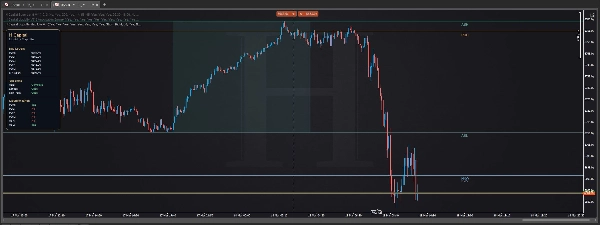
H Capital Liquidity Map Lite เป็นเครื่องมือแผนภูมิฟรีที่ออกแบบมาสำหรับเทรดเดอร์ที่ต้องการโครงสร้างโดยไม่มีความยุ่งเหยิง
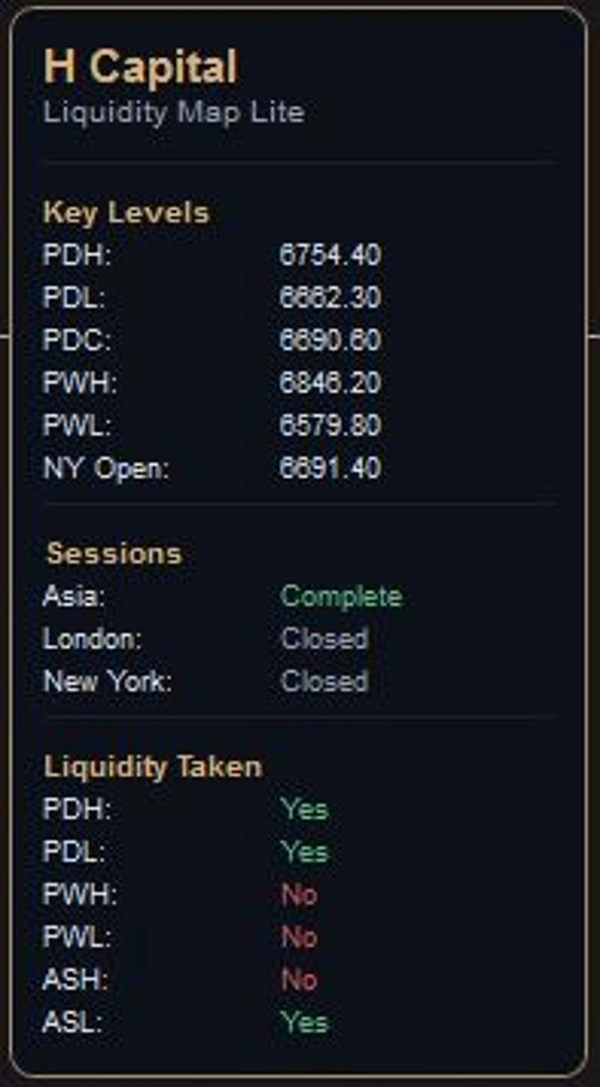
มันทำแผนที่อ้างอิงตลาดสำคัญที่เทรดเดอร์หลายคนติดตามทุกวัน:
- ราคาสูงสุดของวันก่อนหน้า
- ราคาต่ำสุดของวันก่อนหน้า
- ราคาปิดของวันก่อนหน้า
- ราคาสูงสุดของสัปดาห์ก่อนหน้า
- ราคาต่ำสุดของสัปดาห์ก่อนหน้า
- ราคาเปิดนิวยอร์ก
- ช่วงเวลาการซื้อขายในเอเชีย
- สถานะการใช้สภาพคล่อง
เป้าหมายง่ายๆ คือ: ให้เทรดเดอร์มีกรอบงานที่ชัดเจนก่อนการดำเนินการ
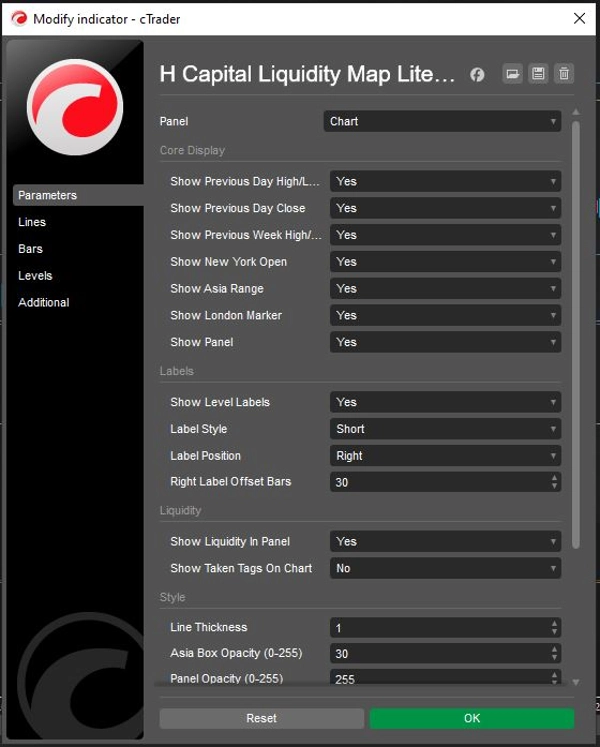
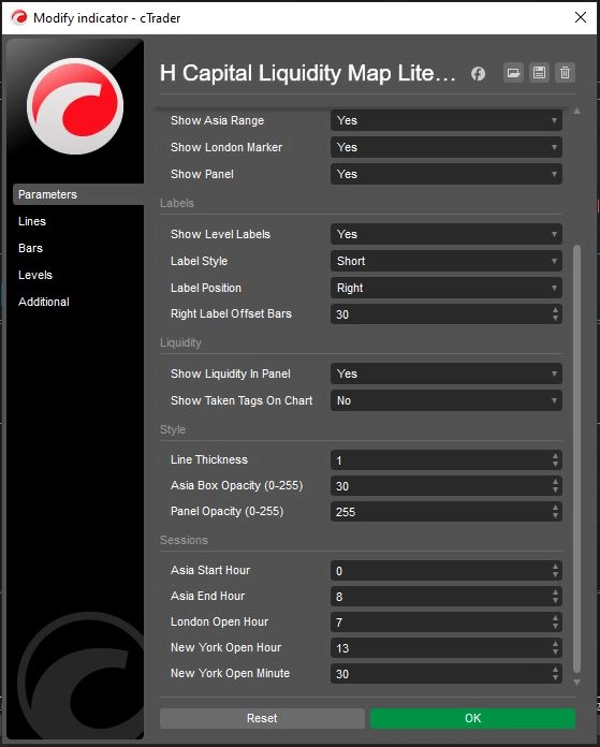
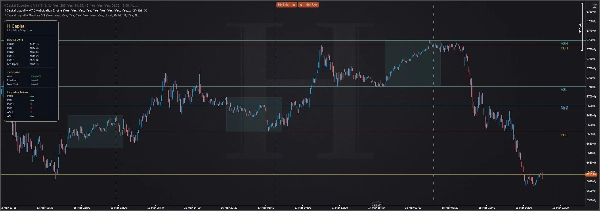
แทนที่จะเติมแผนภูมิด้วยสัญญาณมากมาย H Capital Liquidity Map Lite มุ่งเน้นที่ระดับและการอ้างอิงช่วงเวลาที่ช่วยสร้างบริบท อินเทอร์เฟซถูกออกแบบด้วยสไตล์มินิมัลลิสต์ระดับพรีเมียมเพื่อให้แผนภูมิอ่านง่ายในขณะที่ข้อมูลยังคงเข้าถึงได้อย่างรวดเร็ว
เหมาะสำหรับ:
- เทรดเดอร์ดัชนี
- เทรดเดอร์ฟอเร็กซ์
- เทรดเดอร์โลหะ
- เทรดเดอร์ที่เน้นสภาพคล่อง
- เทรดเดอร์ที่ชอบแผนภูมิที่สะอาด
สิ่งที่ทำได้:
- ทำแผนที่ระดับสภาพคล่องรายวันและรายสัปดาห์ที่สำคัญ
- แสดงโครงสร้างช่วงเวลา
- ติดตามว่าระดับสำคัญถูกใช้ไปหรือไม่
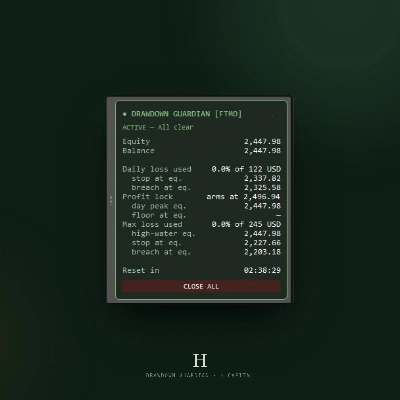
- เก็บข้อมูลอย่างเป็นระเบียบผ่านแผงควบคุมบนแผนภูมิระดับพรีเมียม
สิ่งที่ไม่ทำ:
- ไม่สร้างสัญญาณซื้อ/ขาย
- ไม่ทดแทนการตัดสินใจดำเนินการ
- ไม่ทำงานเป็นเครื่องมือแจ้งเตือน
นี่ไม่ใช่เครื่องมือสัญญาณ แต่มันคือแผนที่ตลาดระดับมืออาชีพ
สรุป
สรุปโดย AI
H Capital Liquidity Map Lite is a charting tool designed to provide traders with a clear, uncluttered view of key daily and weekly liquidity levels. It displays important market references such as the previous day’s high, low, and close; previous week’s high and low; New York open; Asia session range; and liquidity taken status. The tool organizes this information within a minimalist, premium on-chart panel to maintain readability and quick accessibility.
This indicator is suited for traders in indices, forex, metals, and those focusing on liquidity-based strategies who prefer clean chart layouts. It helps build market context by mapping session structures and tracking whether significant levels have been breached. The tool does not generate buy or sell signals, replace execution judgment, or function as an alert system. Instead, it serves as a professional market map to support informed trading decisions.
This indicator is suited for traders in indices, forex, metals, and those focusing on liquidity-based strategies who prefer clean chart layouts. It helps build market context by mapping session structures and tracking whether significant levels have been breached. The tool does not generate buy or sell signals, replace execution judgment, or function as an alert system. Instead, it serves as a professional market map to support informed trading decisions.
โปรไฟล์อินดิเคเตอร์
รีวิวจากลูกค้า
0.0
รีวิว: 0
รีวิวจากลูกค้า
ยังไม่มีรีวิวสำหรับผลิตภัณฑ์นี้ หากเคยลองแล้ว ขอเชิญมาเป็นคนแรกที่บอกคนอื่น!
การสนทนา
คำถามที่พบบ่อย
Prop
Forex
Indices
Commodities
Crypto
Grid
ผลิตภัณฑ์ที่มีให้บริการผ่าน cTrader Store รวมถึงบอทการเทรด อินดิเคเตอร์ และปลั๊กอิน มีให้บริการโดยนักพัฒนาบุคคลที่สามและมีไว้เพื่อวัตถุประสงค์ในการเข้าถึงข้อมูลและทางเทคนิคเท่านั้น cTrader Store ไม่ใช่โบรกเกอร์และไม่ได้ให้คำแนะนำการลงทุน คำแนะนำส่วนบุคคล หรือการรับประกันผลการดำเนินงานในอนาคต
เพิ่มเติมจากผู้เขียนคนนี้


ราคา
ตั้งแต่ 09/03/2026
1.58M
ปริมาณการเทรด
15.43K
Pips ที่ได้กำไร
252
ติดตั้งฟรี