
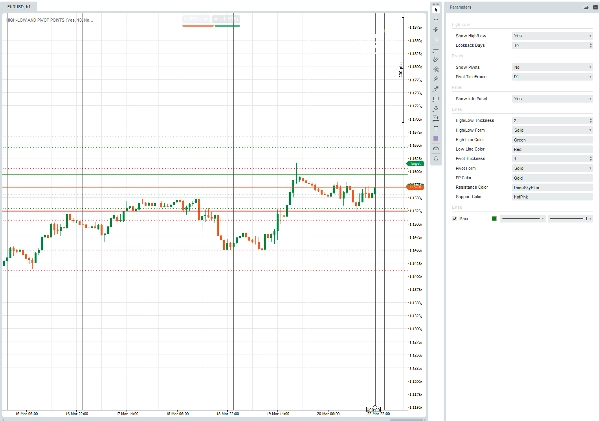
PIVOT POINTS, HIGH-LOW OF THE DAY
Indicatore
108 download
Versione 1.0, Mar 2026
Windows, Mac
Descrizione
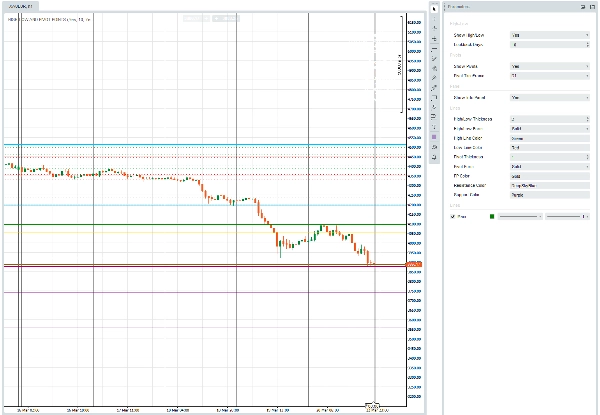
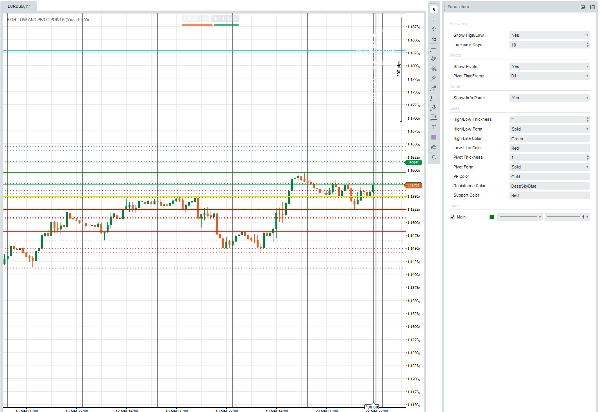
HIGH-LOW AND PIVOT POINTS è un indicatore overlay di cTrader che traccia i livelli di prezzo massimo/minimo giornalieri e i classici punti pivot direttamente sul tuo grafico.
Parametri a colpo d'occhio:
GruppoCosa controlli
High-Low
Mostra/nascondi linee; quanti giorni passati visualizzare (Lookback Days)
Pivots
Mostra/nascondi linee; quale timeframe guida il calcolo del pivot (Giornaliero, Settimanale, ecc.)
Pannello
Mostra/nascondi la casella informativa sul grafico che elenca i prezzi correnti e i livelli pivot
Linee
Spessore, stile (Solido / Puntinato / Molto Puntinato) e colore per le linee High, Low, PP, Resistenza e Supporto
Cosa disegna:
- Massimo/Minimo di oggi nei colori scelti; i giorni precedenti del lookback in una versione più chiara/sottile dello stesso.
- Sette livelli pivot standard — PP, R1–R3, S1–S3 — calcolati dalla barra completata precedente del timeframe pivot selezionato.
- Un pannello informativo in alto a destra che riassume il Massimo/Minimo del giorno in tempo reale, l'intervallo di lookback multi-giornaliero e tutti e sette i prezzi pivot.
Riepilogo
Riepilogo AI
The "Pivot Points, High-Low of the Day" indicator for cTrader overlays daily high and low price levels along with classic pivot points directly on trading charts. It visually displays today's high and low prices, as well as those from prior days based on a configurable lookback period. The indicator calculates and plots seven standard pivot levels—Pivot Point (PP), Resistance levels R1 to R3, and Support levels S1 to S3—derived from the previous completed bar of a selectable timeframe (e.g., daily or weekly). Users can customize visibility, line thickness, style (solid, dotted, very dotted), and colors for all lines including high, low, pivot, resistance, and support. An optional on-chart info panel summarizes live day high/low, multi-day range, and all pivot prices for quick reference. This tool supports multiple markets and symbols including Forex pairs (EURUSD, GBPUSD, NZDUSD, USDJPY), cryptocurrencies (BTCUSD), commodities (XAUUSD), indices (NAS100), and stocks. It is designed to assist traders in identifying key price levels and potential breakout or reversal points based on historical price data and pivot calculations.
Profilo indicatore
Recensioni dei clienti
0.0
Recensioni: 0
Recensioni dei clienti
Questo prodotto non ha ancora ricevuto recensioni. L'hai già provato? Fallo sapere agli altri per primo!
Discussioni
Domande frequenti
BTCUSD
Forex
Breakout
Indices
EURUSD
Commodities
GBPUSD
NZDUSD
Crypto
Stocks
XAUUSD
NAS100
USDJPY
I prodotti disponibili tramite cTrader Store, inclusi bot di trading, indicatori e plugin, sono forniti da sviluppatori terzi e resi disponibili esclusivamente a scopo informativo e di accesso tecnico. cTrader Store non è un broker e non fornisce consulenze in materia di investimento, raccomandazioni individualizzate o garanzie di risultati futuri.
Altro da questo autore


Prezzo
45
Vendite
306
Installazioni gratuite