Описание
━━━━━━━━━━━━━━━━━━━━━━━━━━━━━━━━━━━━━━━━
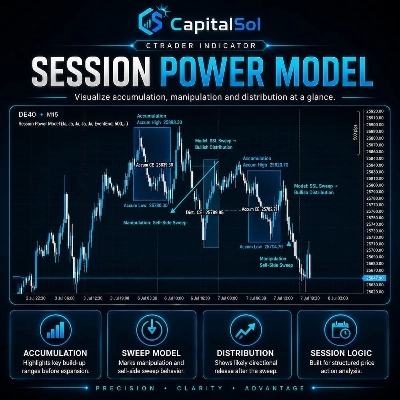
HTF Bias Panel — Смещение
━━━━━━━━━━━━━━━━━━━━━━━━━━━━━━━━━━━━━━━━
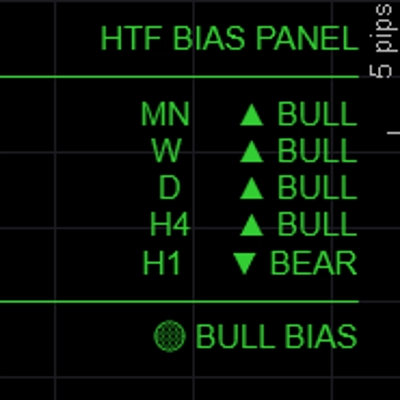
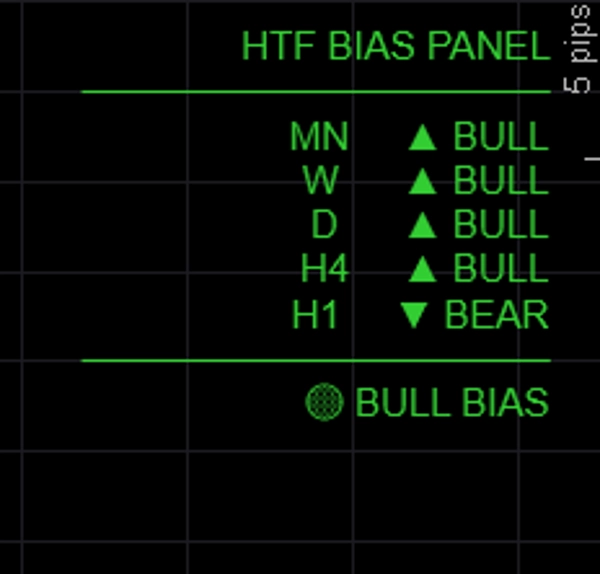
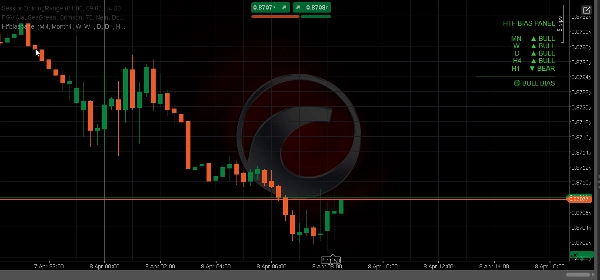
Отображает направленное смещение для до пяти таймфреймов одновременно в чистой панели на графике — чтобы вы всегда знали, являются ли старшие таймфреймы бычьими, медвежьими или смешанными перед входом в сделку.
─────────────────────────────
КЛЮЧЕВЫЕ ОСОБЕННОСТИ
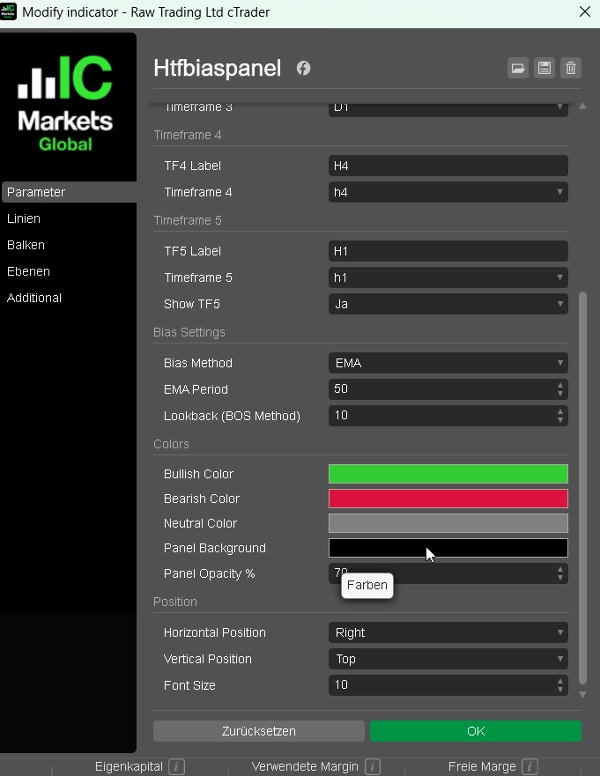
► 5 полностью настраиваемых таймфреймов — по умолчанию MN / W / D / H4 / H1, все метки и TF настраиваемы
► Три метода определения смещения — выберите, как определяется смещение для каждой сессии:
• EMA: закрытие выше/ниже EMA(50) → самый надежный для следования за трендом
• Цена против последнего закрытия: текущее закрытие против предыдущего закрытия → реактивный, основанный на импульсе
• BOS: недавний диапазон против предыдущего диапазона → смещение на основе структуры
► Сводка выравнивания — ПОЛНЫЙ БЫК / ПОЛНЫЙ МЕДВЕДЬ / БЫЧЬЕ СМЕЩЕНИЕ / МЕДВЕЖЬЕ СМЕЩЕНИЕ / НЕЙТРАЛЬНО отображается внизу панели
► Цветовая кодировка — зеленый для бычьего, красный для медвежьего, серый для нейтрального
► Позиция панели — разместите вверху слева, вверху справа, вверху по центру, внизу слева или внизу справа
► Полностью настраиваемые цвета для бычьих, медвежьих и нейтральных состояний
► Легковесный — без графических элементов, без прямоугольников, без нагрузки
─────────────────────────────
ОБЪЯСНЕНИЕ МЕТОДОВ СМЕЩЕНИЯ
→ EMA (по умолчанию): бычье, если закрытие > EMA(период). Самый стабильный, игнорирует краткосрочные шумы.
→ Цена против последнего закрытия: бычье, если закрытие текущего бара > закрытия предыдущего бара. Быстрый и реактивный.
→ BOS: сравнивает недавний диапазон из N баров с предыдущим диапазоном из N баров. Бычье, если выше максимумы и выше минимумы.
─────────────────────────────
НАСТРОЙКИ ПО УМОЛЧАНИЮ
→ TF1 Ежемесячный (MN)
→ TF2 Еженедельный (W)
→ TF3 Дневной (D)
→ TF4 H4
→ TF5 H1 (переключаемый)
→ Метод смещения EMA
→ Период EMA 50
→ Цвет быков LimeGreen
→ Цвет медведей Crimson
→ Позиция Вверху слева
─────────────────────────────
КАК ИСПОЛЬЗОВАТЬ
1. Добавьте панель на любой график
2. Выберите предпочитаемый метод смещения (EMA рекомендуется для новичков)
3. Проверьте сводку выравнивания перед входом в сделку — берите длинные позиции только при БЫЧЬЕМ СМЕЩЕНИИ или ПОЛНОМ БЫЧЬЕМ
4. Используйте смещение HTF для фильтрации сигналов из вашего индикатора BOS/CHoCH или FVG — торгуйте только в направлении, подтвержденном панелью
5. Настройте таймфреймы в соответствии с вашим стилем торговли (например, D / H4 / H1 / M15 / M5 для скальперов)
─────────────────────────────
ИДЕАЛЬНО ДЛЯ
✔ Трейдеров ICT и Smart Money Concepts, которым нужен быстрый анализ сверху вниз
✔ Мульти-таймфрейм трейдеров, желающих быстро проверить визуальное смещение
✔ Трейдеров FTMO и проп-фирм, которым нужно торговать с конгруэнтностью
✔ Любого трейдера, который хочет избежать торговли против тренда старшего таймфрейма
✔ Трейдеров Forex, Gold, Индексов и крипто CFD
─────────────────────────────
СОВМЕСТИМОСТЬ
→ Платформа cTrader (настольная и веб-версия)
→ Классы активов Forex, Индексы, Товары, Крипто CFD
→ Таймфреймы Все (M1 до MN)
→ Права доступа Не требуются
→ Тип счета Реальный и демо
━━━━━━━━━━━━━━━━━━━━━━━━━━━━━━━━━━━━━━━━
Сводка
Отзывы покупателей
5 | 75 % | |
4 | 25 % | |
3 | 0 % | |
2 | 0 % | |
1 | 0 % |


![Логотип продукта "[Stellar Strategies] MARSI Signal Plotter"](https://cdn.ctrader.com/image/webp/7b2b8da6-8f8e-4646-8d4a-4710c516c01e_25567)


