คำอธิบาย
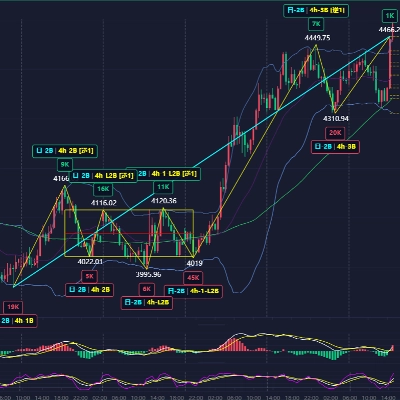
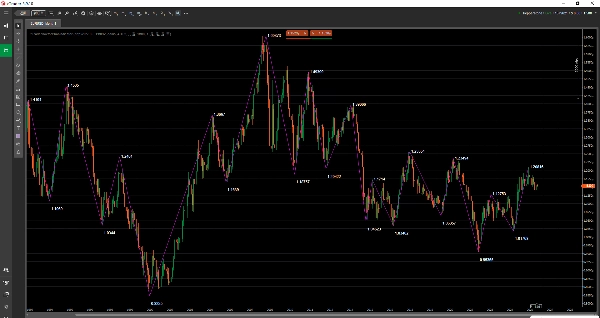
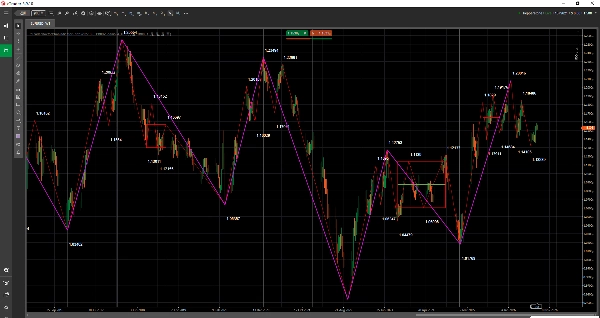
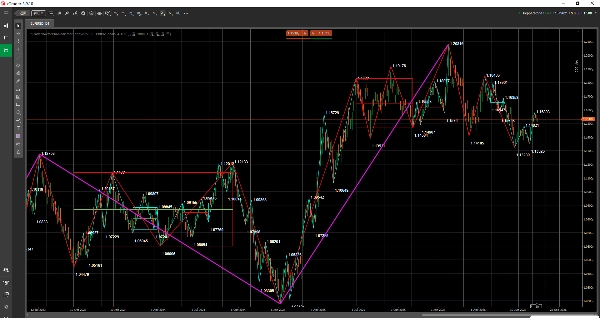
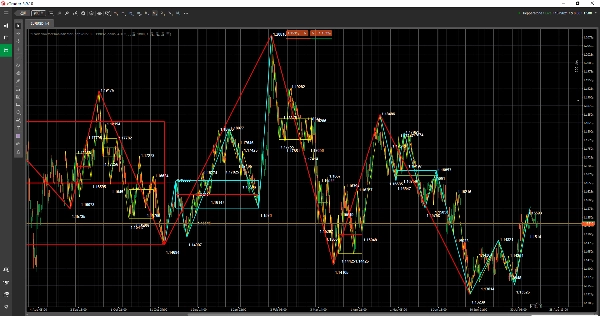
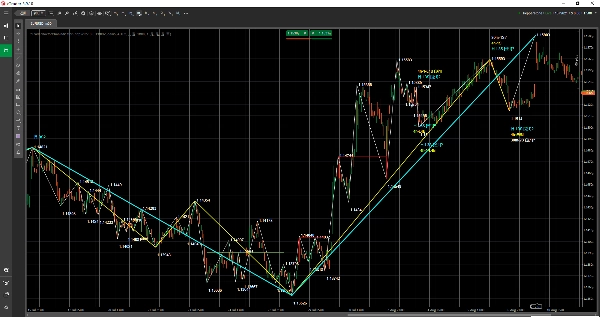
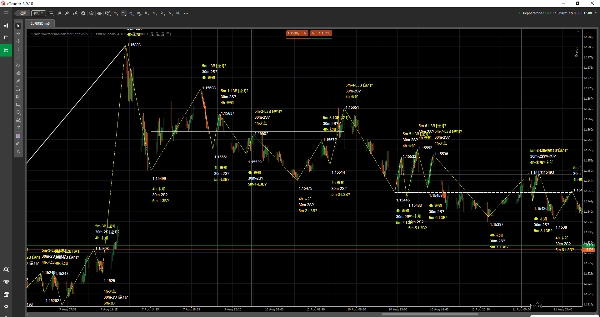
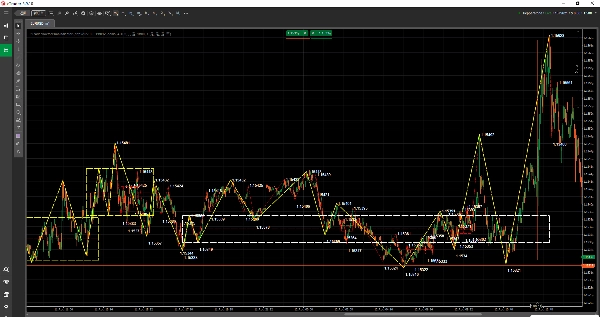
ดัชนีทฤษฎี Dr Chan สำหรับ cTrader เป็นตัวบ่งชี้วิเคราะห์ทางเทคนิคแบบโครงสร้างตลาด / ซ้อนกราฟที่ใช้แสดงโครงสร้างทฤษฎี Dr Chan บนกราฟ cTrader
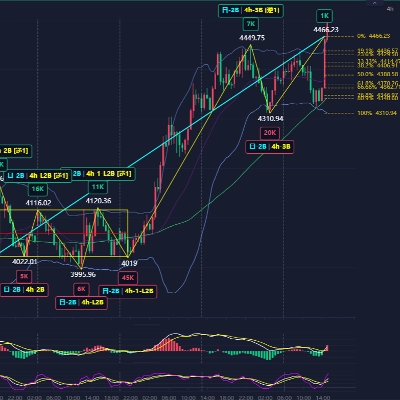
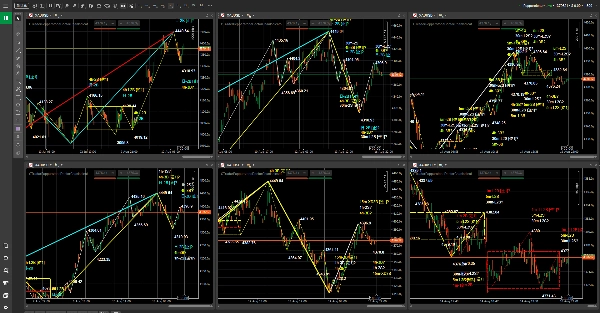
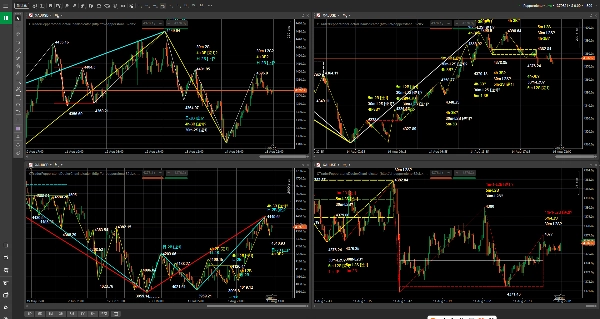
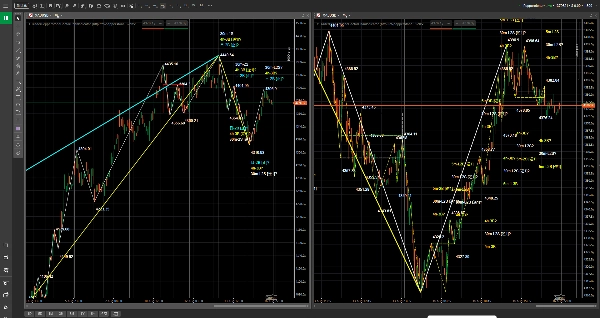
เหมาะสำหรับเทรดเดอร์ที่เน้นการเคลื่อนไหวของราคา โครงสร้างแนวโน้ม และการวิเคราะห์หลายกรอบเวลา ตัวบ่งชี้จะแสดงโครงสร้างสำคัญของทฤษฎี Dr Chan เป็นวัตถุกราฟ รวมถึงโครงสร้าง Bi โซน Zhongshu เครื่องหมายซื้อ/ขาย และอื่นๆ ช่วยให้ผู้ใช้สังเกตจังหวะตลาด การเปลี่ยนแปลงโครงสร้าง และความสัมพันธ์ระหว่างกรอบเวลาต่างๆ ได้อย่างชัดเจนยิ่งขึ้น
ตัวบ่งชี้นี้ไม่ใช่หุ่นยนต์เทรดอัตโนมัติและไม่ใช่บริการสัญญาณการเทรด จุดประสงค์เพื่อช่วยให้ผู้ใช้สามารถอ่านกราฟ ทบทวนตลาด และวางแผนการเทรดได้ชัดเจนขึ้น
เวอร์ชันปัจจุบันรองรับสัญลักษณ์และกรอบเวลาที่ระบุของ Pepperstone cTrader ผลิตภัณฑ์นี้เป็นตัวบ่งชี้อิสระจากบุคคลที่สาม ไม่ใช่ผลิตภัณฑ์อย่างเป็นทางการของ Pepperstone หรือผลิตภัณฑ์พันธมิตรของ Pepperstone
ภาพรวมตัวบ่งชี้
- ประเภทตัวบ่งชี้: ตัวบ่งชี้โครงสร้างตลาด / ซ้อนกราฟ
- เครื่องมือที่แนะนำ: สัญลักษณ์ Forex ดัชนี สินค้าโภคภัณฑ์ สกุลเงินดิจิทัล และ CFD หุ้นที่ระบุใน Pepperstone cTrader
- กรอบเวลาที่แนะนำ: 1 นาที, 5 นาที, 15 นาที, 30 นาที, 1 ชั่วโมง, 4 ชั่วโมง, รายวัน, รายสัปดาห์ และรายเดือน
- กรณีการใช้งานเทรด: การสังเกตโครงสร้างกราฟ, การวิเคราะห์หลายกรอบเวลา, การเตรียมแผนการเทรด และการสนับสนุนการทบทวน
สิ่งที่คุณจะเห็นบนกราฟ
- โครงสร้าง Bi: ใช้สังเกตจังหวะสวิงและความก้าวหน้าของโครงสร้าง
- โซน Zhongshu: ใช้สังเกตพื้นที่รวมตัวสำคัญ สมดุล และการทับซ้อนของโครงสร้าง
- เครื่องหมายซื้อ/ขาย: ช่วยระบุตำแหน่งอ้างอิงโครงสร้างสำคัญ
- ป้ายข้อความ เส้นแนวนอน เส้นแนวตั้ง พื้นที่สี่เหลี่ยม เส้นแนวโน้ม และวัตถุกราฟอื่นๆ
- รองรับการจับคู่ข้อมูลอัตโนมัติกับกรอบเวลาปัจจุบันของกราฟ ทำให้การสังเกตหลายกรอบเวลาง่ายขึ้น
ตัวบ่งชี้นี้เหมาะสำหรับใคร
- ผู้ใช้ที่กำลังเรียนรู้หรือใช้ทฤษฎี Dr Chan และการวิเคราะห์โครงสร้างทฤษฎี Chan
- ผู้ใช้ที่ต้องการดูข้อมูลโครงสร้างโดยตรงบนกราฟ cTrader
- ผู้ใช้ที่ใช้ Pepperstone เพื่อดู Forex ดัชนี สินค้าโภคภัณฑ์ สกุลเงินดิจิทัล หรือ CFD หุ้น
- เทรดเดอร์ที่ต้องการเปรียบเทียบโครงสร้างแนวโน้มในกรอบเวลาต่างๆ
- ผู้ใช้ที่ต้องการทำให้กระบวนการอ่านกราฟ วางแผน และทบทวนชัดเจนขึ้น
การเข้าถึงและการอนุญาตใช้งาน
การเข้าถึงและการอนุญาตใช้งานผลิตภัณฑ์จะถูกจัดการผ่านกระบวนการซื้อ ทดลอง และติดตั้งใน cTrader Store โปรดดูสถานะการซื้อ สถานะการทดลอง และข้อมูลผลิตภัณฑ์ที่แสดงบนหน้าผลิตภัณฑ์ใน cTrader Store
สัญลักษณ์ Pepperstone ที่รองรับในปัจจุบัน
Forex:
GBPUSD, EURUSD, USDJPY, USDCHF, AUDUSD, USDCAD, GBPJPY
ดัชนี:
US500, NAS100, GER40, UK100, JPN225, VIX, HSTECH
สินค้าโภคภัณฑ์:
XAUUSD, XAGUSD
สกุลเงินดิจิทัล:
BTCUSD, ETHUSD
หุ้น:
AAPL.US-24, MSFT.US-24, GOOG.US-24, AMZN.US-24, TSLA.US-24, NVDA.US-24, META.US-24, NFLX.US-24, JPM.US-24
กรอบเวลาที่รองรับ
1 นาที, 5 นาที, 15 นาที, 30 นาที, 1 ชั่วโมง, 4 ชั่วโมง, รายวัน, รายสัปดาห์ และรายเดือน
ขั้นตอนการทำงานที่แนะนำ
1. เปิดกราฟสำหรับสัญลักษณ์ที่รองรับในสภาพแวดล้อม Pepperstone cTrader
2. โหลดตัวบ่งชี้ Dr Chan Theory Indicator ลงบนกราฟ
3. เวลาข้อมูลของ Dr Chan Theory Indicator เป็น UTC+0 เมื่อตรวจสอบโครงสร้างกราฟ ให้เปลี่ยนโซนเวลาของกราฟ cTrader เป็นโซนเวลาที่สอดคล้องก่อนเปรียบเทียบตำแหน่ง
4. ตรวจสอบให้แน่ใจว่ากรอบเวลาปัจจุบันของกราฟได้รับการรองรับ ตัวบ่งชี้จะจับคู่ข้อมูลกับกรอบเวลาของกราฟโดยอัตโนมัติ
5. เปิดหรือปิด "Show Bi", "Show Zhongshu" และ "Show Buy/Sell" ตามความจำเป็น
6. สังเกตโครงสร้างกราฟร่วมกับแผนการเทรด การจัดการตำแหน่ง และการควบคุมความเสี่ยงของคุณ
การตั้งค่าพารามิเตอร์
เวอร์ชันปัจจุบันเปิดเผยเพียง 3 พารามิเตอร์ที่มองเห็นได้ในแผงตัวบ่งชี้ cTrader เท่านั้น กรอบเวลาข้อมูล คำนำหน้าสัญลักษณ์โบรกเกอร์ แคช รีเฟรช การถ่ายโอนแบบบีบอัด และการตั้งค่าการบันทึกจะถูกจัดการภายในโดยตัวบ่งชี้และไม่จำเป็นต้องตั้งค่าสำหรับการใช้งานปกติ
Show Bi
ค่าเริ่มต้น: "true"
แสดงโครงสร้าง Bi หรือไม่
Show Zhongshu
ค่าเริ่มต้น: "true"
แสดงโซน Zhongshu หรือไม่
Show Buy/Sell
ค่าเริ่มต้น: "true"
แสดงเครื่องหมายซื้อ/ขายหรือไม่
หมายเหตุสำคัญ
- ผลิตภัณฑ์นี้เป็นตัวช่วยวิเคราะห์ทางเทคนิค ไม่ใช่หุ่นยนต์เทรดอัตโนมัติ
- ตัวบ่งชี้ไม่ทำการสั่งซื้อขายโดยอัตโนมัติ
- ตัวบ่งชี้ไม่ใช่คำแนะนำการลงทุน บริการสัญญาณการเทรด หรือการรับประกันผลกำไร
- เวอร์ชันปัจจุบันรองรับเฉพาะสัญลักษณ์และกรอบเวลาที่ระบุของ Pepperstone cTrader เท่านั้น
- เวลาข้อมูลของ Dr Chan Theory Indicator เป็น UTC+0 เมื่อนำไปแสดงบนกราฟ cTrader โปรดเปลี่ยนโซนเวลากราฟให้ตรงกันก่อนตรวจสอบตำแหน่งโครงสร้าง
- ผู้ใช้ควรใช้ร่วมกับแผนการเทรด การจัดการตำแหน่ง การควบคุมความเสี่ยง และการตัดสินใจอย่างอิสระของตนเอง
ทิศทางการอัปเดตในอนาคต
เวอร์ชันที่ปล่อยในปัจจุบันเน้นสัญลักษณ์และกรอบเวลาที่ระบุของ Pepperstone cTrader การอัปเดตในอนาคตอาจขยายไปยังโบรกเกอร์อื่นๆ การแมปสัญลักษณ์เพิ่มเติม และขอบเขตการให้บริการข้อมูลที่ครบถ้วนมากขึ้นตามแผนผลิตภัณฑ์
คำเตือนความเสี่ยง
การเทรดในตลาดการเงินมีความเสี่ยง ผลการดำเนินงานในอดีตไม่รับประกันผลลัพธ์ในอนาคต ตัวบ่งชี้นี้เป็นเพียงเครื่องมือช่วยวิเคราะห์ทางเทคนิคและการเรียนรู้เท่านั้น ไม่ใช่คำแนะนำการลงทุน บริการสัญญาณการเทรด หรือการรับประกันผลกำไร โครงสร้างในอดีตไม่ได้แสดงถึงผลลัพธ์ในอนาคต ผู้ใช้ควรทดสอบอย่างเต็มที่ในสภาพแวดล้อมการเทรดของตนเองและใช้อย่างระมัดระวังร่วมกับกฎการจัดการความเสี่ยง