present
Sign up and get $50 off your first purchase
Sample EMA
Indicator
Version 1.0, Feb 2025
Windows, Mac
Since 13/02/2025

Description

Summary

AI summary
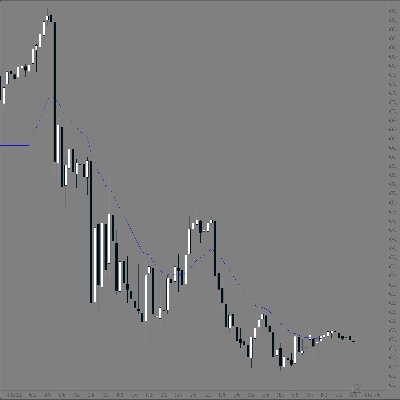
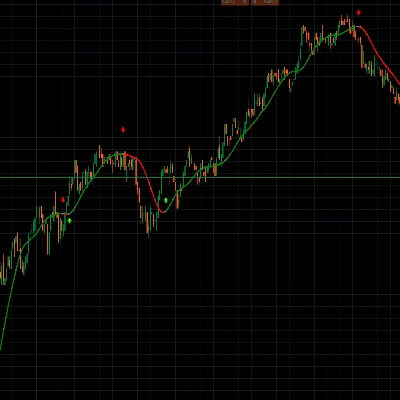
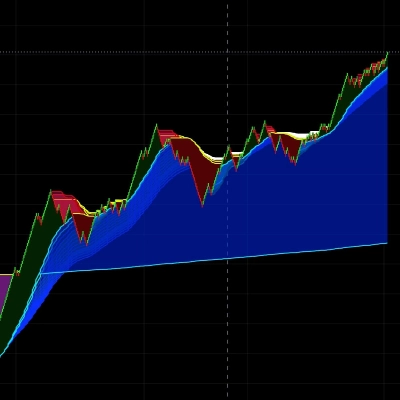
Sample EMA is an indicator for the cTrader (cAlgo) platform that combines the SuperTrend and Moving Average (MA) concepts into a single tool called SuperTrendMA. It calculates a user-selectable type of moving average (default is Exponential) over a specified period (MA Length). It also computes the Average True Range (ATR) over a defined ATR Period and applies an ATR Multiplier to generate SuperTrend bands. Market trends are identified based on price position relative to these bands: an uptrend is signaled when the price closes above the DownTrend Band, and a downtrend when it closes below the UpTrend Band. The indicator visually represents trends with colored lines—lime for uptrend and red for downtrend—and provides trade entry signals using arrows: green arrows indicate a shift from downtrend to uptrend (buy signal), and red arrows indicate a shift from uptrend to downtrend (sell signal). This indicator supports trend analysis and trade signal generation by integrating volatility and moving average data.
Indicator profile

Discussion

Customer reviews

0.0
Reviews: 0
Customer reviews
No reviews for this product yet. Already tried it? Be the first to tell others!

FAQ

Supertrend
ATR
Products available through cTrader Store, including trading bots, indicators and plugins, are provided by third-party developers and made available for informational and technical access purposes only. cTrader Store is not a broker and does not provide investment advice, personal recommendations or any guarantee of future performance.


You may also like

Indicator
Volume
Support & Resistance
Compare up to 27 symbols across eight timeframes with seven analysis engines and an interactive cTrader dashboard.
Indicator
Prop
ZigZag
+5
All-in-One ICT/SMC Institutional Framework — Ranges, Structure, Liquidity, Fibonacci & Time Engine.
Indicator
SMC
Breakout
+1
Delta Peak Bubbles is a tick‑chart overlay for cTrader that highlights the strongest momentum spikes.
Indicator
ATR
RSI
+11
This indicator puts three helpful trading tools on your chart at once. Think of it like having three expert traders
Indicator
Forex
BTCUSD
+6
All-In-One solution for ICT's FVG IFVG ORDERBLOCK in advanced mode.
Indicator
EURUSD
GBPUSD
+1
An exponential moving average based on regular trading hours.
Indicator
Prop
Forex
+4
Period Separator that shows on all timeframes including renko and range bars.
Indicator
RSI
VWAP
+5
Trend direction, chart signals, reversal zones and volume tools in one configurable indicator.
Indicator
Prop
Forex
+5
Color Volume Bars – Visualize Market Strength Instantly
Indicator
Prop
Forex
+12
⚡ ADXVMA Aurora Trend Filter combines ADX trend strength with an adaptive EMA blend ⚡
Indicator
Prop
Forex
+4
Draws pivots (P, S/R, CPR) from selected anchors like H1–Month1, with optional mid-levels (PS1, S1S2, etc.)
Indicator
AI
SMC
+5
Coloring trendline/ Colored Trendline / Color Trendline
Indicator
Indicator calculates spread in pips
Indicator
ATR
Channel
+1
Bollinger Bands Advanced Squeeze & Breakout System, Real-Time On-Chart Dashboard, Auto-Squeeze Detector, Dual-Band Cloud
Indicator
RSI
Forex
+4
New version of one of my favorites includes Fibonacci and moving average convergence divergence lines
Indicator
Forex
EURUSD
+5
With this Fibonacci retracement indicator, traders have full control over the retracement levels displayed on the chart.
Indicator
SMC
VWAP
+16
It calculates Anchored VWAP and StdDev bands from a user-defined start date for cTrader charts.
Indicator
RSI
Fibonacci
+1
Spot RSI divergences on your chart and get an entry, stop and six targets when your filters line up.

Price

Since 13/02/2025