
Beschreibung
🚀 EGO's HF Zones Zeichenwerkzeug: Blitzschnelle, pixelgenaue Zonen
Müde davon, mit nativen Charting-Tools zu kämpfen? Verbringst du zu viel Zeit damit, Rechtecke manuell zu ziehen, anstatt den Markt wirklich zu analysieren? Lerne deinen neuen unfairen Vorteil kennen.
EGO’s HF Zones Zeichenwerkzeug ist ein Premium-Tool, das über Hotkeys gesteuert wird und entwickelt wurde, um deine Chart-Markup-Routine vollständig zu automatisieren und zu beschleunigen. Zeichne, bearbeite und verwalte deine Handelszonen mit null Reibung und mathematischer Präzision.
📊 Welche Marktdaten es analysiert
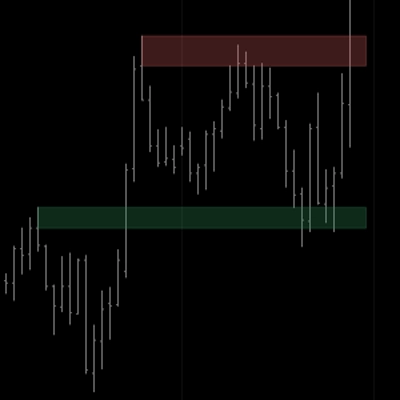
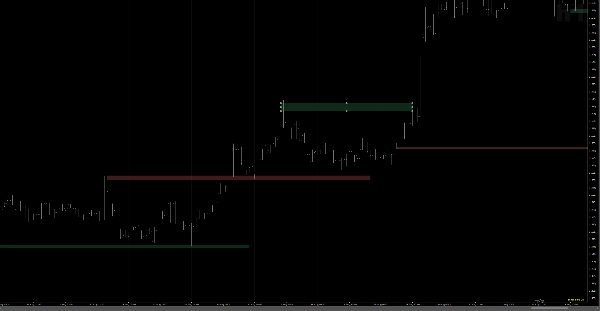
Dies ist kein einfaches Zeichenwerkzeug. Der Indikator analysiert sofort Echtzeit-OHLC-Daten (Open, High, Low, Close) der Kerzen, auf die dein Mauszeiger zeigt. Er berechnet die genaue Spanne zwischen dem Kerzenkörper und dem Docht und erzeugt automatisch eine pixelgenaue Zone, die präzise an den Marktdaten ausgerichtet ist. Kein Zoomen mehr, um schlampige Kanten zu korrigieren!
🎨 Interpretation von Signalen & Visualisierungen
Das Tool automatisiert vollständig deine Farbcodierung. Basierend auf der Richtung der zugrundeliegenden Kerze weist es sofort ein bullishes (z.B. Nachfrage / Unterstützung) oder bärisches (z.B. Angebot / Widerstand) Farbschema zu.
- Grüne/bullishe Zone: Wird automatisch auf bullischen Kerzen gezeichnet.
- Rote/bärische Zone: Wird automatisch auf bärischen Kerzen gezeichnet. Möchtest du die Ausrichtung ändern? Ein einfacher Doppelklick auf die Zone tauscht sofort ihre Farbe.
⚙️ Wichtige Einstellungen & Hotkeys (Der Zauber)
Geschwindigkeit ist alles. Wir haben mühsame Menüs durch intuitive Tastatur- und Maus-Kombinationen ersetzt:
- Doppelklick oder Shift + Klick (auf leerem Bereich): Erstelle sofort eine neue Zone, die perfekt an die Kerze unter deinem Cursor angepasst ist.
- Doppelklick (auf einer Zone): Tausche die Farbe der Zone (Bullish ↔ Bearish).
- Alt + Klick (auf einer Zone): Verlängere die Zone sofort in die Zukunft um deine vordefinierte Anzahl von Bars.
- Strg + Klick (auf einer Zone): Richte die Zone präzise wieder an ihrer Ursprungs-Kerze aus.
- Shift + Klick (auf einer Zone): Lösche die Zone sofort.
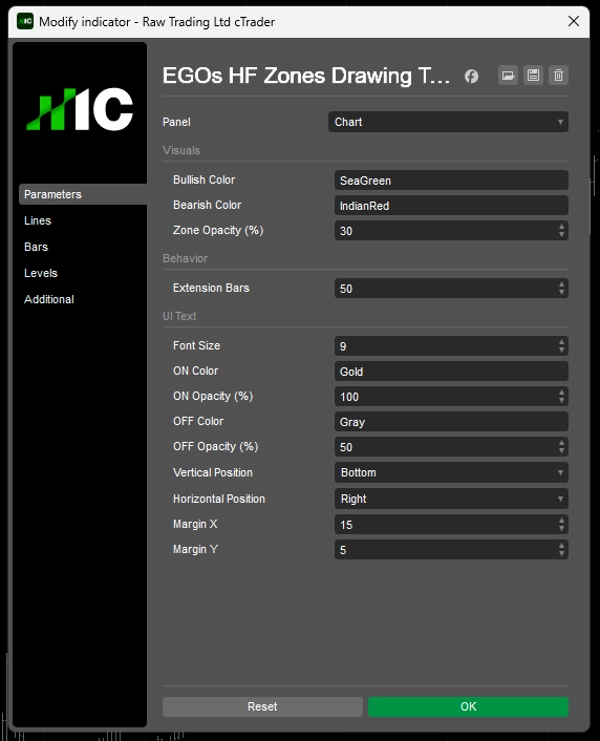
- Anpassung: Vollständig anpassbare Farben, 0-100% Deckkraft und benutzerdefinierte Text-UI-Positionierung. Drücke 'H' auf deiner Tastatur, um ein elegantes, im Chart eingeblendetes Spickzettel umzuschalten, damit du keine Tastenkombination vergisst!
🎯 Typische Anwendungsfälle & Handelsszenarien
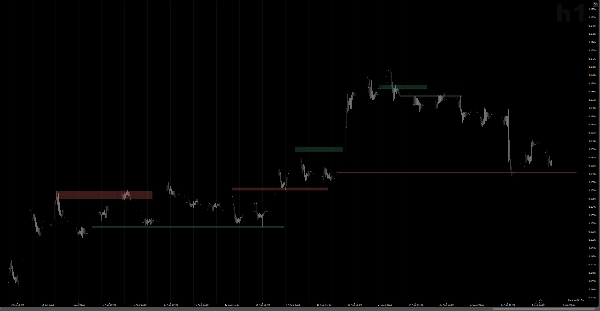
Speziell für Top-Down-Analyse entwickelt. Egal, ob du makroökonomische Monats-/Wochen-Trends kartierst oder H1-Ausführungsbereiche verfeinerst, dieses Tool reduziert die Chart-Markup-Zeit um 80%. Es ist der absolute beste Begleiter zum Zeichnen von:
- Angebots- & Nachfragezonen
- Order Blocks (OB) & Fair Value Gaps (FVG)
- Wichtige Unterstützungs- & Widerstandsniveaus
- Konfluenzzonen für Ausbruch- oder Rücksetz-Einstiege.
👤 Für wen ist dieser Indikator?
Wenn deine Strategie auf Zonen basiert, ist dies ein Muss für dein Toolkit.
- SMC (Smart Money Concepts) & Price Action Trader: Die chirurgisch präzise Order Blocks benötigen.
- Swing- & Positionstrader: Die mehrere Charts und Zeitrahmen verwalten und ihren Arbeitsbereich sauber und effizient halten wollen.
- Erfahrungslevel: Von Anfängern, die sauberere, fehlerfreie Charts wollen, bis zu erfahrenen Profis, die ihre Zeit schätzen und Effizienz verlangen.
⚠️ Wichtige Hinweise & Einschränkungen
Um blitzschnelle Leistung zu gewährleisten und Konflikte mit den nativen Doppelklick-Eigenschaften von cTrader zu vermeiden, arbeitet das Tool mit einer genialen Bearbeitungsmodus Funktion.
- Zonenbearbeitung: AUS (Standard): Zonen sind fixiert. Deine Hotkeys (Farbwechsel, Verlängern, Löschen) funktionieren sofort, ohne dass die Zone versehentlich verschoben wird.
- Zonenbearbeitung: EIN (Drücke
Rechte Shift): Zonen werden "entsperrt". Du kannst jetzt native cTrader-Funktionen nutzen, um Ecken manuell mit der Maus zu ziehen, zu strecken oder zu verschieben.
Höre auf, manuell Rechtecke zu zeichnen. Automatisiere deine Routine, eliminiere Pixel-Fehler und handle mit absoluter Präzision. Hol dir noch heute EGO's HF Zones Zeichenwerkzeug!
Zusammenfassung
Key features include instant zone creation, resizing, extending, deleting, and re-snapping using intuitive keyboard and mouse shortcuts, eliminating manual rectangle drawing. Users can customize colors, opacity, and text positioning, with an on-chart shortcut reference available.
The tool supports top-down analysis across multiple timeframes, facilitating the marking of supply and demand zones, order blocks, fair value gaps, key support and resistance levels, and confluence zones for breakout or pullback entries. It is suitable for Smart Money Concepts and price action traders, swing and position traders, and users of all experience levels seeking precise, efficient chart markup.
An Edit Mode allows toggling between locked zones for quick hotkey actions and unlocked zones for manual adjustments using native chart functions. This indicator is optimized for cTrader and focuses on visual zone drawing based on bar data.