present
ลงทะเบียนและรับส่วนลด $50 สำหรับการซื้อครั้งแรกของคุณ
Trading product for Dynamic swing levels reader อินดิเคเตอร์ Fibonacci Fair Value Gap, image 1
Dynamic swing levels reader
อินดิเคเตอร์
1 ดาวน์โหลด
เวอร์ชัน 1.1, Nov 2026
Windows, Mac
Trading product for Dynamic swing levels reader อินดิเคเตอร์ Fibonacci Fair Value Gap, image 2
1
ติดตั้งฟรี

คำอธิบาย

Dynamic Swing Levels Reader - the companion to Flex Renko Inverse

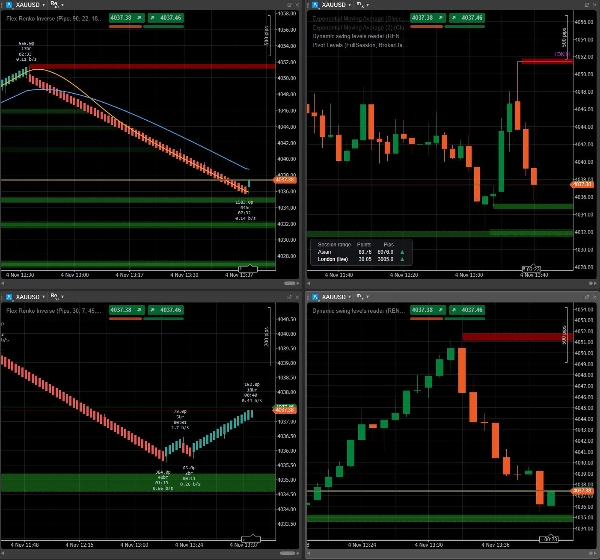
Flex Renko charts are excellent for spotting where the market really turned. Most traders, though, still execute on regular timeframe charts: M1, M5, H1. Dynamic Swing Levels Reader connects the two. It takes the swing zones from a Flex Renko Inverse chart and draws them, live, on any timeframe chart of the same symbol.


What "Requires Flex Renko Inverse" means

This indicator does not calculate anything by itself. It is a reader. The zones are created by Flex Renko Inverse, our main study, which builds renko bricks tick by tick and marks every confirmed reversal as a swing zone. Zones that price has not yet come back to are shared, and the Reader displays exactly those.

Without Flex Renko Inverse running on one of your charts, the Reader has nothing to show. That is why it is free: it extends the main study, it does not replace it.


How it works

  1. Open a Flex Renko Inverse chart and give it a name in "Instance name" (for example RENKO_CONTEXT)
  2. On any timeframe chart of the same symbol, add Dynamic Swing Levels Reader and type the same name in "Read swing levels from"
  3. That's it. The zones appear and stay in sync. When price reaches a zone it disappears from both charts, and new zones show up as soon as the renko chart creates them

Both charts must be open in cTrader on the same computer. If something is not connected (wrong name, different symbol, renko chart closed), the indicator tells you on the chart what is missing.


Why get Flex Renko Inverse

The swing zones are just one of its features. Flex Renko Inverse gives you:

  • Renko bricks built from real ticks, never from aggregated bars, with separate settings for trend continuation and reversal. Closed bricks never repaint
  • Swing zones with strength: the bigger the move that started from a turning point, the more visible its zone
  • Leg labels with the size, number of bricks, duration and speed of every swing, plus an arrow when the current leg is moving faster than usual
  • A rotation dashboard that shows, across 1, 5, 15 and 30 minutes, whether swings are getting wider or narrower and which side is in control
  • Moving averages calculated on bricks, not on hidden candles
  • The real time of every brick under your cursor

Use a slower renko as your context, share its zones, and trade them on the timeframe you are used to.


👉 Get Flex Renko Inverse: https://ctrader.com/products/5546

สรุป

สรุปโดย AI
Dynamic Swing Levels Reader is an indicator designed to display swing level zones generated by the Flex Renko Inverse study on any timeframe chart within cTrader. It functions as a companion tool that reads and visualizes swing zones created by Flex Renko Inverse, which builds Renko bricks tick-by-tick and identifies confirmed reversals as swing zones. These zones are shared live and synchronized between the Flex Renko Inverse chart and any other chart of the same symbol, allowing traders to view Renko-based swing levels on their preferred timeframe charts (e.g., M1, M5, H1).

To use it, a Flex Renko Inverse chart must be open and named; the Dynamic Swing Levels Reader then references this name to display the corresponding swing zones. Zones disappear once price revisits them, and new zones appear as the Renko chart updates. Both charts must be open simultaneously on the same computer.

Flex Renko Inverse offers advanced features including real-tick Renko bricks with separate trend and reversal settings, swing zones weighted by move strength, detailed leg metrics (size, duration, speed), a multi-timeframe rotation dashboard, and moving averages calculated on bricks. This setup enables traders to use slower Renko charts for market context while executing trades on their usual timeframe charts.

โปรไฟล์อินดิเคเตอร์
หมวดหมู่อินดิเคเตอร์
แนวรับและแนวต้าน
ประเภทเอาต์พุต
การแสดงเป็นภาพ
ข้อกำหนดด้านข้อมูล
แท่งเท่านั้น
ข้อมูลภายนอก
สัญญาณที่รองรับ
Cross
Divergence
Breakout
Reversal
ความแข็งแกร่งของแนวโน้ม
ความผันผวน
แตะ Level ที่ระบุ
เบรก Level ที่ระบุ

การสนทนา

รีวิวจากลูกค้า

0.0
รีวิว: 0
รีวิวจากลูกค้า
ยังไม่มีรีวิวสำหรับผลิตภัณฑ์นี้ หากเคยลองแล้ว ขอเชิญมาเป็นคนแรกที่บอกคนอื่น!

คำถามที่พบบ่อย

Fibonacci
Fair Value Gap
Key Levels
Order Block
Market Structure
Supply & Demand
Support & Resistance
ผลิตภัณฑ์ที่มีให้บริการผ่าน cTrader Store รวมถึงบอทการเทรด อินดิเคเตอร์ และปลั๊กอิน มีให้บริการโดยนักพัฒนาบุคคลที่สามและมีไว้เพื่อวัตถุประสงค์ในการเข้าถึงข้อมูลและทางเทคนิคเท่านั้น cTrader Store ไม่ใช่โบรกเกอร์และไม่ได้ให้คำแนะนำการลงทุน คำแนะนำส่วนบุคคล หรือการรับประกันผลการดำเนินงานในอนาคต

เพิ่มเติมจากผู้เขียนคนนี้

"Flex Renko Inverse" โลโก้
เรตติ้งสูง
4.2
(4)
$99
อินดิเคเตอร์
Pin Bar
Order Block
+5
NEVER MISS A TREND & LET TRENDS RUN with Sierra Chart's Flex Renko Inverse, rebuilt for cTrader.
อินดิเคเตอร์
Fibonacci
Key Levels
+5
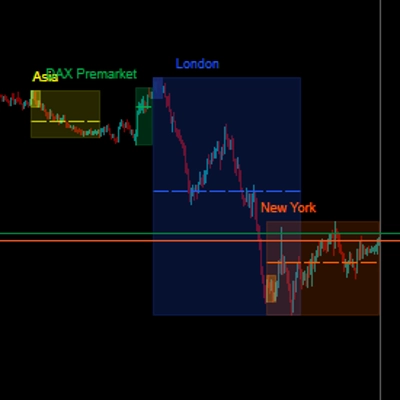
Draws RTH, Asian, London, prior day/week, ORB, Floor and Camarilla pivot levels as rays, with a session range table.

นอกจากนี้คุณยังอาจชอบ

อินดิเคเตอร์
MSS
Stochastic
+2
One glance, one answer. Strong Buy, Strong Sell, or Ranging from a single fused Supertrend + Stochastic signal.
อินดิเคเตอร์
BOS
CHOCH
+5
BOS/CHoCH signals confirmed by liquidity sweep + FVG confluence, with a live conviction score.
อินดิเคเตอร์
Volume
Fibonacci
+3
Draw and manage multiple fixed-range volume profiles with persistent levels, developing POC/VA and smart alerts.
"8 Currencies_NSC" โลโก้
ยอดนิยม
4.4
(5)
$19
อินดิเคเตอร์
Forex
NZDUSD
+2
RCS: 8 majors! AUD,USD,EUR,JPY,GBP,CAD,CHF,NZD. Find how strong each currency is relatively and trade smarter!
อินดิเคเตอร์
Volume
Liquidity Sweep
+1
Liquidity Profiler Tools
อินดิเคเตอร์
Show your Daily/Weekly Risk
"ZigZag" โลโก้
เรตติ้งสูง
4.3
(6)
ฟรี
อินดิเคเตอร์
ATR
RSI
+7
ZigZag filters noise, spots trends, patterns, pivots, aiding analysis, trade management, and confirmations. 📉📈
อินดิเคเตอร์
Key Levels
Liquidity Grab
+1
Visualize Asia, London and New York sessions with range boxes, opening levels, prior-day highs/lows and sweep markers.
อินดิเคเตอร์
Imbalance
Fair Value Gap
+4
Fair Value Gap scanner with live fill telemetry, 50% CE lines, 4 mitigation rules, and a 3-stage native alert system.
อินดิเคเตอร์
SMC
VWAP
+16
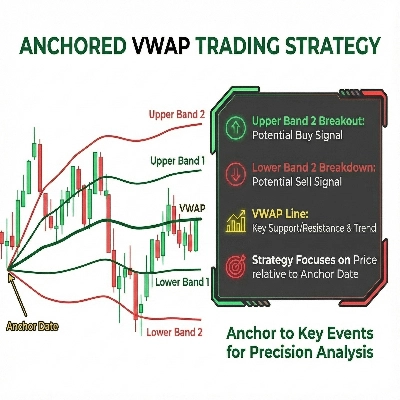
It calculates Anchored VWAP and StdDev bands from a user-defined start date for cTrader charts.
อินดิเคเตอร์
BOS
EMA
+5
Market structure signals graded A to C, each with a drawn trade plan, plus an adaptive trend ribbon and a trend matrix
อินดิเคเตอร์
Fibonacci
Key Levels
+1
Explore Elliott wave counts, three swing sizes and example levels with an interactive cTrader chart panel.
อินดิเคเตอร์
ATR
Market Structure
+3
Support Resistance Toolkit
อินดิเคเตอร์
SMC
Prop
+11
Sessions PRO is a professional session visualization indicator - 4 Fully Customizable Sessions
"THIS BURNS JP225 INDICATOR" โลโก้
เรตติ้งสูง
4.5
(6)
$25
/
$30
อินดิเคเตอร์
AI
Signal
+1
🔥 THIS BURNS JP225 INDICATOR – Professional Trading Signals
อินดิเคเตอร์
SMC
VWAP
+4
Killzone Session and key levels with VWAP – Precision Meets Price Action
"MACD Pro Trader" โลโก้
ยอดนิยม
4.6
(5)
$19
/
$20
อินดิเคเตอร์
MACD
Forex
+5
🚀 MACD Pro Trader – Advanced MACD with buy/sell signals, custom MAs & color-coded histograms for smarter trading! 📈🔥
อินดิเคเตอร์
Forex
Enhance your trading strategy with automated detection and alerts for key chart patterns.

ราคา

1
ติดตั้งฟรี