
คำอธิบาย
Quantum Currency Strength Lite
Overview & Market Data Analysed
This indicator calculates a multi-currency data matrix to track the relative strength of four major currencies in any timeframe: USD, EUR, GBP, and JPY. It extracts data from the primary pairs in the background to build an integrated geometric index. The calculation uses time-synchronised bar data to maintain structural alignment across distinct symbol data feeds.
Interpretation of Visual Elements
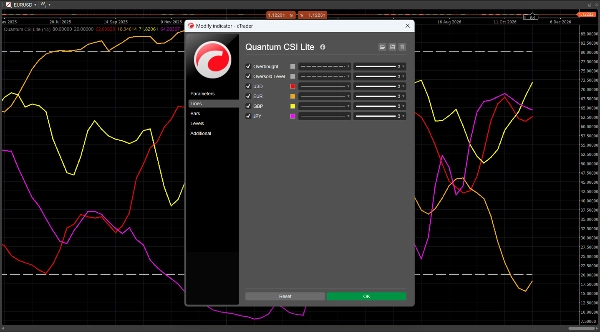
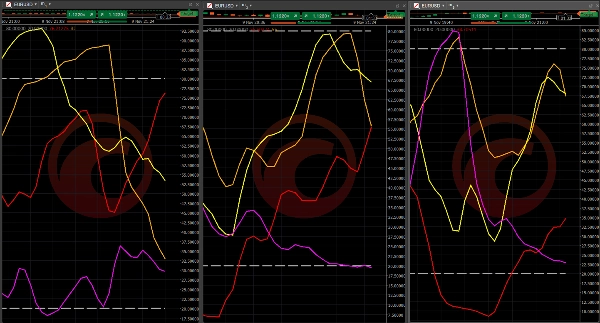
- Currency Lines (Red, Orange, Yellow, Magenta): Represent the relative strength tracking path of individual currencies based on an underlying Relative Strength Index (RSI) calculation of the geometric index.
- Level 80 Line (Dark Grey): A standard upper boundary threshold marking an area where the relative tracking metric is historically extended to the upside and where a currency may potentially be overbought.
- Level 20 Line (Dark Grey): A standard lower boundary threshold marking an area where the relative tracking metric is historically extended to the downside and where a currency may potentially be oversold.
Key Settings & Parameters
- RSI Period: Controls the lookback period used for the internal calculation loop (Default value: 14 bars).
- Show Currency Toggles: Boolean settings allowing the user to display or hide the individual lines for the USD, EUR, GBP, or JPY to organise chart space.
Typical Use Cases & Trading Scenarios
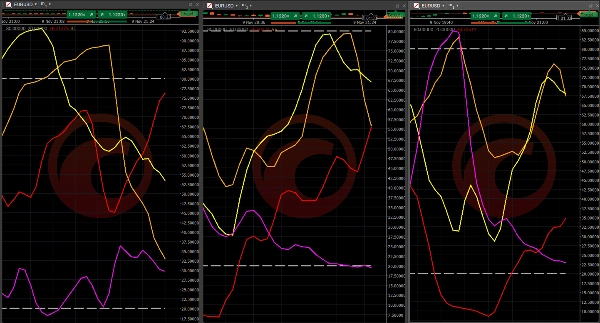
Traders use this tool to visually monitor raw changes in divergence and convergence between individual major currencies. This visual analysis helps identify periods when a currency line reaches an extreme boundary level (above 80 or below 20) or when two lines cross, signalling a potential shift in relative strength. Potential reversals occur when one currency begins reversing to the upside while a second begins reversing to the downside, giving the trader the opportunity to identify possible trend reversals and confirm them with further chart analysis. Strong trends occur when two currencies move strongly in opposite directions. Congestion occurs when they move together in the same direction. Always use the indicator across three timeframes, as shown in the images below.
Target Audience & Suitability
This tool is intended for technical analysts, currency traders, and algorithmic chartists of all experience levels who require raw relative strength metrics. It is designed for those who incorporate multi-symbol correlation data into their analytical setups.
Important Limitations & Operational Notes
- Not a Standalone System: This indicator is an analytical tool and does not provide trade entry or exit signals on its own.
- Methodology Integration Required: This tracking strength indicator must be used in conjunction with other technical analysis methodologies. We highly recommend combining its outputs with volume price analysis (VPA), order flow tools, or structural price action to confirm market conditions before making decisions.
- Free Version Configuration: This Lite version is structurally limited to four major currencies: USD, EUR, GBP, and JPY. To use other global currencies, you need the premium version, which includes all eight.
สรุป
Key features include adjustable RSI period settings and options to toggle the visibility of each currency line for customized chart organization. Traders use this tool to monitor divergence and convergence among currencies, identify extreme strength levels, and detect potential trend reversals or strong trends through line crossovers and directional movements. It is recommended to apply the indicator across three timeframes for comprehensive analysis.
Quantum Currency Strength Lite is intended for technical analysts and currency traders who incorporate multi-symbol correlation data into their strategies. It serves as an analytical tool and should be used alongside other technical methods such as volume price analysis, order flow, or price action for trade decision confirmation. This Lite version is limited to the four specified currencies; additional currencies are available in the premium version.