
Penerangan
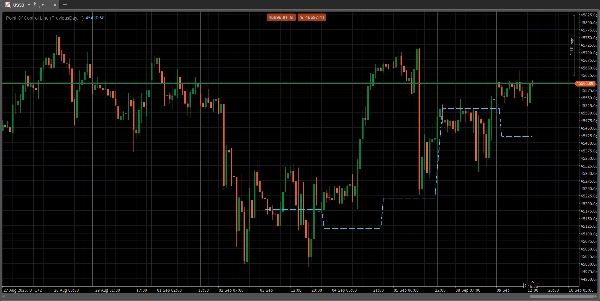
Titik Kawalan (POC) adalah tahap harga pada carta profil volum di mana jumlah dagangan paling banyak telah dijalankan dalam tempoh yang ditetapkan. Tahap ini bertindak sebagai zon sokongan atau rintangan yang penting kerana ia mewakili harga di mana institusi perdagangan besar paling aktif dan di mana harga pasaran mencapai konsensus. Pedagang menggunakan POC untuk mengenal pasti zon harga utama, mengukur sentimen pasaran, dan menjangka pergerakan harga serta pembalikan yang berpotensi.
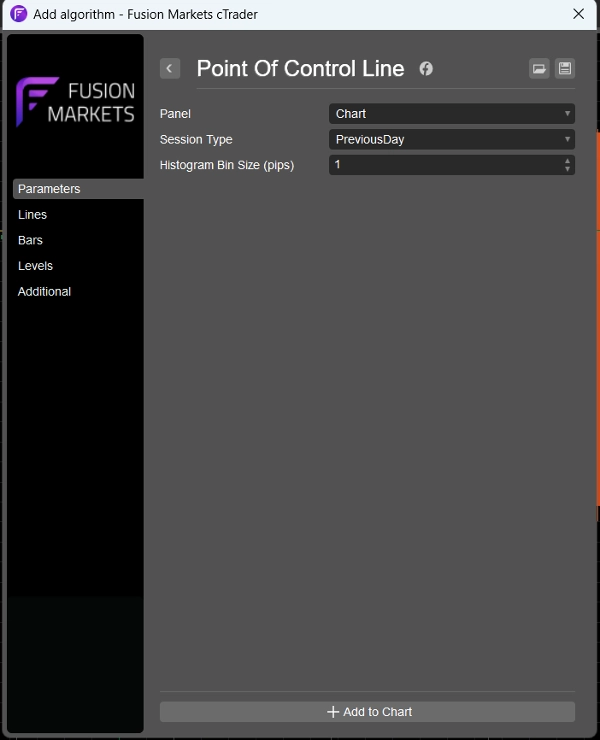
Saya telah mengeluarkan semua bunyi daripada penunjuk profil volum biasa dengan hanya meninggalkan garis POC untuk mereka yang hanya memerlukan garis tersebut. Saya telah memasukkan parameter untuk melihat garis POC sama ada untuk hari sebelumnya, profil volum 4 jam atau 1 jam supaya ia sesuai untuk pedagang dengan jangka masa yang berbeza.
Ringkasan
Ulasan pelanggan
5 | 100 % | |
4 | 0 % | |
3 | 0 % | |
2 | 0 % | |
1 | 0 % |


