
Penerangan
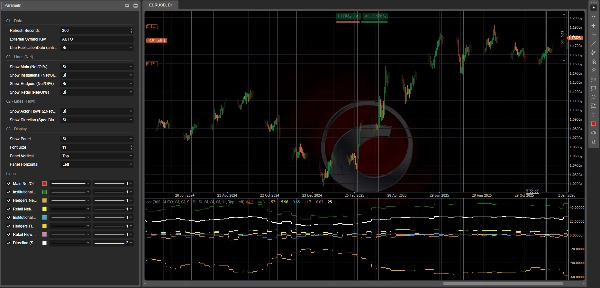
📊 Sejarah Penunjuk COT Pro — Aliran Pelakon + Arah (Institusi / Hedgers / Runcit)
CotIndicatorHistoryPro membawa bacaan Commitments of Traders (COT) yang maju terus ke carta anda, dengan pecahan jelas mengikut peserta pasaran (Institusi, Hedgers/Komersial, Runcit).
Ia menunjukkan bukan sahaja di mana setiap pelakon ditempatkan (terutamanya panjang/pendek), tetapi juga apa yang mereka lakukan sekarang (meningkatkan posisi panjang atau pendek), serta satu garis sintetik Arah untuk menyerlahkan kecenderungan yang sedang berlaku.
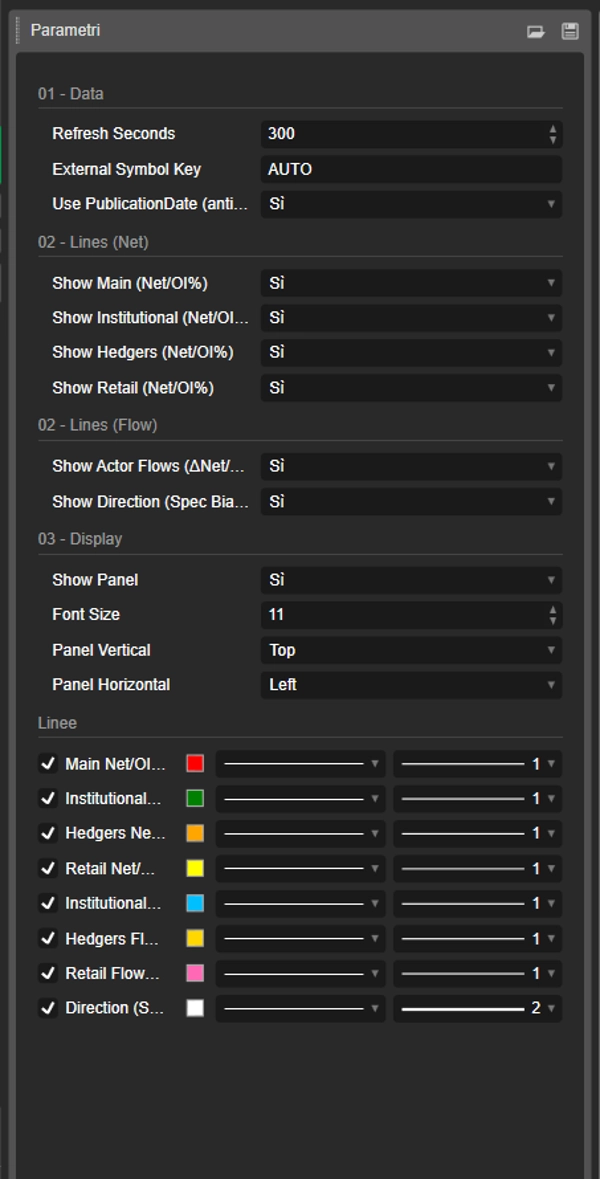
Penunjuk ini memuatkan set data dari suapan JSON yang selamat (SEJARAH + OUTPUT) dan menyelaraskannya dengan selamat pada carta (pilihan anti-lookahead menggunakan PublicationDate).
🗓️ Kemas Kini Data Mingguan (Jumaat 21:00)
Set data COT dikemas kini setiap Jumaat jam 21:00 (waktu Eropah/Rome) terima kasih kepada saluran automasi khusus:
skrip pemprosesan canggih melakukan pengiraan dan menerbitkan nilai terkini ke suapan JSON yang digunakan oleh penunjuk (dan ekosistem cBot berkaitan jika dipasang).
✅ Penunjuk itu sendiri menyegarkan di platform menggunakan tetapan Refresh Seconds anda dan akan memaparkan data mingguan baru sebaik sahaja ia diterbitkan.
✅ Apa Yang Anda Dapat (Garis + Panel)
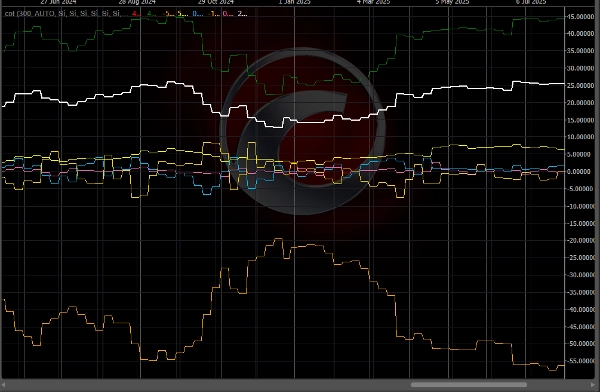
🔥 Garis “Aliran” (3 Pelakon) — ΔNet/OI%
Garis-garis ini mewakili perubahan minggu ke minggu dalam posisi Bersih, dinormalisasi oleh Minat Terbuka:
- 🔵 Aliran Institusi (ΔNet/OI%)
- 🟡 Aliran Hedgers / Komersial (ΔNet/OI%)
- 💗 Aliran Runcit (ΔNet/OI%)
📌 Cara membacanya:
- Di atas 0 ⇒ pelakon sedang meningkatkan LONG Bersih (menambah posisi panjang dan/atau menutup posisi pendek)
- Di bawah 0 ⇒ pelakon sedang meningkatkan SHORT Bersih (menambah posisi pendek dan/atau mengurangkan posisi panjang)
- Nilai mutlak yang lebih besar (contoh, ±1.5%, ±3%) ⇒ perubahan posisi yang lebih kuat dan bermakna
🧭 Garis “Arah” — Spec Bias Net/OI%
- ⚪ Arah (Spec Bias) Net/OI% merumuskan arah “spekulatif” yang sedang berlaku (purata Institusi + Runcit, dengan sandaran jika perlu).
📌 Cara membacanya:
- > 0 ⇒ Bias Spekulatif PANJANG
- < 0 ⇒ Bias Spekulatif PENDEK
- ≈ 0 ⇒ FAEDAH / neutral fasa
🧩 Panel Maklumat (Konteks Penuh)
Panel terbina dalam memaparkan:
- 📄 Tarikh Laporan / Tarikh Penerbitan
- 📌 Minat Terbuka + WoW (perubahan minggu ke minggu)
- 🎯 Isyarat teks (jika tersedia dalam OUTPUT)
- Untuk setiap pelakon:
-
- Bias (terutamanya PANJANG / PENDEK / FAEDAH) berdasarkan Bersih
- Net/OI%
- Aliran (ΔNet/OI%)
- WoW ΔLong / ΔShort / ΔNet untuk memahami bagaimana posisi berubah
🧠 Cara Membacanya (Mudah & Praktikal)
✅ Aliran vs Bias (Perbezaan Utama)
- Aliran = apa yang mereka lakukan sekarang (menambah posisi panjang atau pendek)
- Bias = bagaimana mereka ditempatkan secara keseluruhan (terutamanya panjang atau pendek)
Contoh:
- Bias Institusi PANJANG + Aliran positif ⇒ mereka masih menolak posisi panjang
- Bias Institusi PANJANG + Aliran negatif ⇒ pengurangan posisi panjang / kemungkinan putaran
🚦 Senario Perdagangan Tipikal
✅ Senario A — Pengesahan Trend
- Arah > 0
- Aliran Institusi > 0
➡️ Tekanan panjang adalah konsisten: sering kali satu persediaan sambungan.
✅ Senario B — Potensi Pembalikan (Wang Pintar vs Runcit)
- Aliran Institusi > 0 manakala Aliran Runcit < 0
➡️ Runcit menjual/memendek manakala institusi membeli: kemungkinan pengumpulan.
(Berlawanan = kemungkinan pengagihan)
✅ Senario C — Hedgers sebagai “Amaran”
- Hedgers pada tahap melampau (Net/OI jauh dari neutral) + Aliran kuat
➡️ Zon lebihan yang mungkin / lindung nilai agresif (sering lebih baik sebagai amaran daripada pencetus kemasukan langsung).
✅ Senario D — Pasaran “Memuatkan” (Risiko Pecah)
- Aliran kuat + Minat Terbuka WoW meningkat
➡️ Posisi baru sedang masuk: kebarangkalian pergerakan lanjutan sering meningkat.
⚡ Rutin Bacaan 10 Saat
- Periksa Arah: PANJANG (>0) atau PENDEK (<0)
- Periksa Aliran Institusi: mengesahkan atau berbeza?
- Periksa Aliran Runcit: mengesahkan atau sebaliknya?
- Periksa Minat Terbuka WoW: pengembangan atau pembubaran posisi?
✅ Simbol Disokong + Legenda Utama (Kunci Simbol JSON)
Penunjuk boleh menganalisis mana-mana instrumen yang tersedia dalam suapan JSON (medan data[].symbol dalam OUTPUT).
Cara memilih instrumen yang betul
- Kunci Simbol Luaran = AUTO 👉 secara automatik menggunakan simbol carta (dan mengeluarkan sebarang sufiks selepas “.”, contohnya
US2000.ecn→US2000). - Jika broker anda menggunakan nama simbol yang berbeza 👉 tetapkan Kunci Simbol Luaran kepada kunci JSON tepat (tidak mengira huruf besar/kecil).
Kunci semasa dalam suapan (contoh snapshot: reportDate 2026-02-17, publicationDate 2026-02-20)
- FX:
AUDUSD,EURUSD,GBPUSD,USDMXN - Indeks:
US100,US2000,DOW30,VIX - Komoditi/Logam/Pertanian:
BRENT,WTI,COPPER,CORN,WHEAT,XAU(Emas),XAG(Perak) - Kripto:
BTC,ETH
📌 Jika anda tidak melihat nilai pada carta:
- sahkan simbol carta sepadan dengan kunci JSON
- tetapkan Kunci Simbol Luaran secara manual (contoh,
ETH,US2000) - periksa panel Tarikh Laporan/Penerbitan untuk mengesahkan set data terkini dimuatkan
⚙️ Nota
- Menyokong penjajaran yang lebih selamat dengan Gunakan PublicationDate (anti-lookahead) ✅
- Garis dan panel boleh diaktifkan/dinonaktifkan secara berasingan.
📌 Penafian: penunjuk maklumat sahaja, bukan nasihat kewangan. Data COT adalah mingguan dan harus dikontekstualisasikan dengan trend, tahap utama, dan volatiliti.
Ringkasan
The indicator sources data from a secured JSON feed updated every Friday at 21:00 (Europe/Rome time) and aligns it on the chart using publication dates to prevent lookahead bias. Users can view flow lines for each actor, a direction line indicating overall market bias, and an info panel detailing report dates, open interest, net positions, and weekly changes.
It supports a wide range of instruments including Forex pairs (e.g., EURUSD, GBPUSD), indices (e.g., US100, DOW30), commodities (e.g., Brent, Gold), and cryptocurrencies (BTC, ETH). Symbol selection can be automatic or manually set to match feed keys.
Typical use cases include trend confirmation, spotting potential reversals by comparing smart money and retail flows, hedger activity alerts, and breakout risk assessment based on open interest changes. The indicator is informational and designed to complement other technical analysis tools.
Ulasan pelanggan
5 | 50 % | |
4 | 50 % | |
3 | 0 % | |
2 | 0 % | |
1 | 0 % |


