![Trading product for Trend Angle Indicator [Iridio Capital] مؤشر Forex Crypto, image 1](https://cdn.ctrader.com/image/webp/28a98496-3412-4fea-82eb-be3347bdd6f1_27612)
![Trading product for Trend Angle Indicator [Iridio Capital] مؤشر Forex Crypto, image 2](https://cdn.ctrader.com/image/webp/1831cdef-6a14-4f6e-9c0b-dfff3d168d29_27613)
الوصف
نظرة عامة
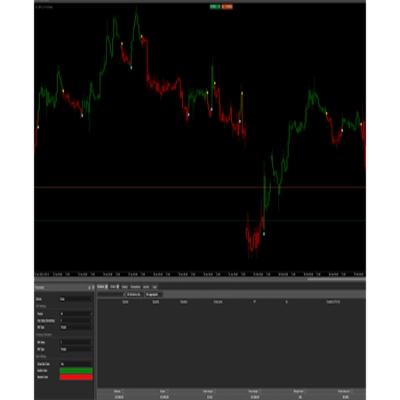
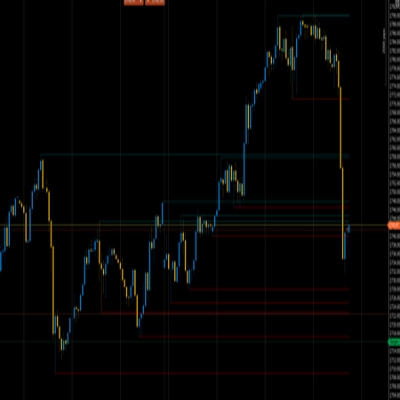
يوفر مؤشر زاوية الاتجاه طريقة واضحة وبديهية لتصور اتجاهات السوق من خلال حساب ميل (بالدرجات) الانحدار الخطي على مجموعة محددة من الأعمدة. بدلاً من الاعتماد على مؤشرات الاتجاه التقليدية التي قد يصعب تفسيرها، يقدم هذا الأداة تمثيلاً زاويًا مباشراً لحركة السعر، مما يجعل من السهل تقييم قوة واتجاه الاتجاه بنظرة سريعة.
كيف يعمل
الانحدار الخطي هو طريقة إحصائية تُستخدم لنمذجة العلاقة بين المتغيرات — في هذه الحالة، حركة السعر مع مرور الوقت. يجد الخط الأفضل ملاءمة الذي يقلل الانحرافات عن قيم السعر الفعلية، مما يسمح لنا بتحديد ميل الاتجاه. من خلال تحويل هذا الميل إلى درجات، يوفر المؤشر طريقة طبيعية وبديهية لتقييم ظروف السوق:
- 0° → سوق جانبي (لا يوجد اتجاه واضح)
- +25° إلى +60° → اتجاه صاعد (كلما زاد الميل، كان الاتجاه أقوى)
- -25° إلى -60° → اتجاه هابط (الزوايا السلبية الحادة تشير إلى تراجع أقوى)
الميزات الرئيسية والقوى
✅ تصور الاتجاه بشكل بديهي – بدلاً من القيم العشوائية، يعبر المؤشر عن الاتجاه بالدرجات، مما يسهل فهم مدى انحدار حركة السوق.
✅ يحدد التماسك والاتجاهات القوية – يبرز المؤشر فترات تماسك السوق (عندما يبقى الميل بين الخطوط الأفقية الخضراء والحمراء) والاتجاهات الصاعدة أو الهابطة القوية عند اختراق هذه الحدود.
✅ تظليل لوني لقوة الاتجاه – المناطق فوق +25° (اتجاه صاعد قوي) وتحت -25° (اتجاه هابط قوي) مظللة، مما يسمح بالتعرف الفوري على التحركات القوية.
✅ يعمل على أي إطار زمني وأصل – سواء كنت تتداول الأسهم أو الفوركس أو العملات الرقمية أو العقود الآجلة، تساعد هذه الأداة في اكتشاف الاتجاهات المهمة عبر الأسواق المختلفة.
كيفية استخدامه
- انظر إلى خط زاوية الاتجاه:
-
- إذا بقي بين +25° و -25°، فإن السوق في حالة تماسك.
- إذا اخترق فوق +25°، فإن الاتجاه الصاعد يزداد قوة.
- إذا انخفض تحت -25°، فإن اتجاه هابط قوي يتشكل.
- استخدم المناطق المظللة لـ تأكيد زخم السوق القوي.
- ادمجه مع مؤشرات أخرى (مثل الحجم، المتوسطات المتحركة) للحصول على تأكيد إضافي.
الملخص
Key features include:
- Intuitive visualization of trend steepness expressed in degrees.
- Identification of market consolidation when the angle remains between +25° and -25°, and detection of strong bullish or bearish trends when breaking these thresholds.
- Color highlighting for quick recognition of strong uptrends (above +25°) and downtrends (below -25°).
- Compatibility with any timeframe and asset class, including stocks, forex, cryptocurrencies, and futures.
Users can monitor the trend angle line to determine market conditions, confirm momentum using highlighted regions, and combine this indicator with others such as volume or moving averages for enhanced analysis.
تقييمات العملاء
5 | 100 % | |
4 | 0 % | |
3 | 0 % | |
2 | 0 % | |
1 | 0 % |

![شعار "High-Low Divergence [Iridio Capital]"](https://cdn.ctrader.com/image/webp/443c4661-7abb-40f1-842f-4b6ec560649b_40914)
![شعار "Wyckoff Toolkit [Iridio Capital]"](https://cdn.ctrader.com/image/webp/8acfe6a1-6a8e-4578-9367-9df3af2b1801_27763)
![شعار "Smart Money Concepts (SMC) [Iridio Capital]"](https://cdn.ctrader.com/image/webp/28b69fd1-ef54-4bed-9487-07e78e883be4_40934)
![شعار "Gaussian Channel [Iridio Capital]"](https://cdn.ctrader.com/image/webp/7c039209-5573-4a54-a072-f9528b503103_41960)
![شعار "Inverse Fair Value Gap (iFVG) [Iridio Capital]"](https://cdn.ctrader.com/image/webp/a7a0633e-91b0-4604-a6a8-1a4c30f68b0f_41954)
![شعار "Session Volume Profile (SVP) [Iridio Capital]"](https://cdn.ctrader.com/image/webp/60a274e6-2495-4d49-83f3-42078e40dc91_40920)
![شعار "Forecast Indicator [Iridio Capital]"](https://cdn.ctrader.com/image/webp/1d489900-f3bc-4a0c-ac55-368b41f69703_41986)