
Descrição
// ══════════════════════════════════════ ══════════════════════════════════════
// 📊 INDICADOR EMA EM TF (MULTI-TIMEFRAME)
// Versão: 1.0.0 - Indicador profissional para análise multi-timeframe
// Autor: Fury Team - Armando Brecciaroli
// Data: 5 de junho de 2025
// ══════════════════════════════════════════════════════════════════════════
//
// DESCRIÇÃO:
// ===========
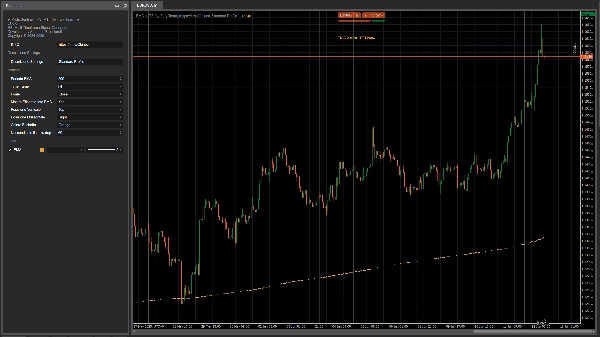
// EMA em TF é um indicador avançado que exibe a média móvel exponencial
// (EMA) calculada em um timeframe específico e projetada no timeframe atual
// do gráfico. Esta ferramenta permite usar médias móveis de timeframes superiores
// (ex: H4, D1) mesmo em gráficos com timeframes inferiores (M15, H1),
// permitindo uma análise multi-timeframe completa e imediata.
//
// PRINCIPAIS CARACTERÍSTICAS:
// ==========================
// - Exibição da EMA de qualquer timeframe no gráfico atual
// - Suporte completo para todos os timeframes disponíveis no cTrader
// - Personalização total do período da EMA e da fonte de preço
// - Gerenciamento do rótulo de informação com posicionamento flexível
// - Sistema de licenciamento seguro e verificação automática de atualizações
// - Totalmente otimizado para alto desempenho mesmo em grandes conjuntos de dados
// - Personalização completa da aparência visual (cores, estilo da linha)
//
// USOS PRÁTICOS:
// ================
// - Identificar tendência de longo prazo em gráfico de timeframe inferior
// - Exibir médias significativas de timeframes superiores
// - Criar estratégias multi-timeframe baseadas em médias móveis
// - Identificar suportes e resistências dinâmicos mais confiáveis
//
// REGISTRO DE ALTERAÇÕES:
// =========
// v1.0.0 (05/06/2025)
// - Lançamento inicial com suporte completo para todos os timeframes
// - Implementação de sistema avançado de gerenciamento de licenças
// - Interface personalizável com HUD informativo
// - Adicionado rótulo informativo no gráfico
// - Sistema integrado de atualização automática
// - Otimização de desempenho para séries temporais extensas
// - Suporte para todas as fontes de preço (Fechamento, Abertura, Máxima, Mínima, etc.)
// - Gerenciamento automático da exibição de mensagens do sistema
// ═══════════════════════════════════════════════════════════════════════════════
Para ativar a licença, siga as informações na tela ou nos logs.
Resumo
Avaliações de clientes
5 | 0 % | |
4 | 100 % | |
3 | 0 % | |
2 | 0 % | |
1 | 0 % |


