
Ichimoku Kinko Hyo
Indicateur
155 téléchargements
Version 1.0, Jul 2025
Windows, Mac
5.0
Avis : 1
Description
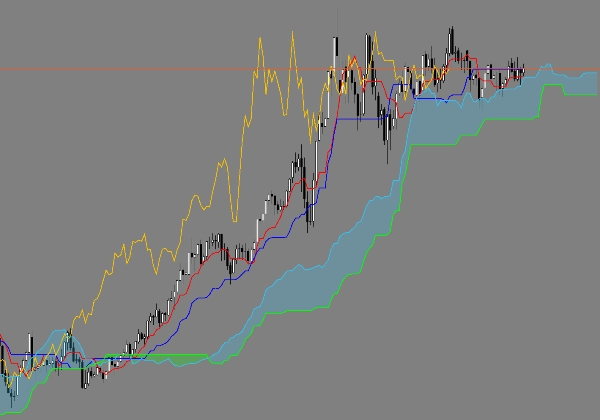
Ceci est un indicateur Ichimoku Kinkō Hyō corrigé pour cTrader. Par défaut, le décalage de cTrader est de 26 et commence à compter à partir de zéro, ce qui provoque un décalage incorrect du Chikou Span et du Kumo (nuage). Cette version corrige cela en utilisant un décalage fixe de 25 périodes à la fois pour le Chikou Span (reculé de 25 périodes) et les lignes du Kumo (avancées de 25 périodes), conformément à la spécification japonaise originale et aux plateformes comme TradingView. Cela garantit que toutes les lignes Ichimoku sont calculées et tracées aux positions correctes pour des signaux et analyses précis.
Résumé
Résumé IA
This product is a corrected Ichimoku Kinkō Hyō indicator designed for the cTrader platform. It addresses an issue in cTrader’s default Ichimoku implementation, where the displacement is set to 26 and counted from zero, causing misalignment of the Chikou Span and Kumo (cloud) lines. This version applies a fixed 25-period shift: the Chikou Span is moved 25 periods backward, and the Kumo lines are shifted 25 periods forward. This adjustment aligns the indicator’s calculations and plotting with the original Japanese Ichimoku specification and other platforms like TradingView. The correction ensures that all Ichimoku lines are displayed in their proper positions, supporting accurate technical analysis and signal interpretation.
Profil de l'indicateur
Avis clients
5.0
Avis : 1
5 | 100 % | |
4 | 0 % | |
3 | 0 % | |
2 | 0 % | |
1 | 0 % |
Discussion
Questions fréquentes
Les produits disponibles sur cTrader Store, notamment les bots de trading, les indicateurs et les plug-ins, sont fournis par des développeurs tiers et mis à disposition à titre informatif et à des fins d'accès technique uniquement. cTrader Store n'est pas un courtier et ne fournit aucun conseil en investissement, aucune recommandation personnelle ni aucune garantie quant aux performances futures.


Prix
Depuis le 20/03/2025
155
Installations gratuites