
50 percent
Gösterge
Sürüm 1.0, Aug 2025
Windows, Mac
5.0
Değerlendirmeler: 2

Açıklama
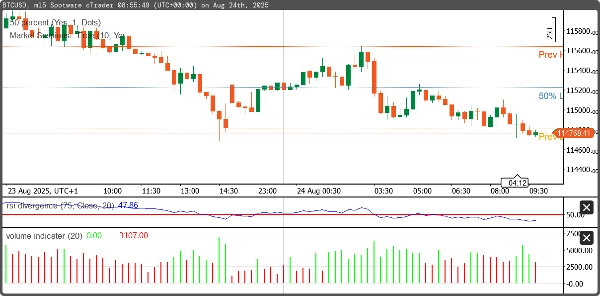
Bu cBot, önceki oturumun yüksek ve düşük fiyatlarını otomatik olarak algılar ve bunların arasındaki orta noktayı hesaplar. Tersine dönme veya kırılma stratejilerinde sıklıkla kullanılan önemli destek/direnç bölgelerini ve piyasa denge seviyelerini belirleyerek traderlara yardımcı olmak için tasarlanmıştır.
- Önceki günün (veya oturumun) yüksek ve düşük seviyelerini algılar.
- Yüksek ve düşük arasındaki orta noktayı hesaplar.
- Grafikte yüksek, düşük ve orta nokta seviyelerini çizer.
Özet
Gösterge profili
Müşteri değerlendirmeleri
5.0
Değerlendirmeler: 2
5 | 100 % | |
4 | 0 % | |
3 | 0 % | |
2 | 0 % | |
1 | 0 % |
Müşteri değerlendirmeleri
August 29, 2025
The screen feels less crowded, but the final call still needs say no.
August 20, 2025
Tartışma
SSS
cTrader Store üzerinden erişilebilen işlem botları, göstergeler ve eklentiler gibi ürünler, üçüncü taraf sağlayıcılar tarafından sağlanır ve yalnızca bilgilendirme ve teknik erişim amaçlarıyla sunulur. cTrader Store bir broker değildir ve yatırım tavsiyesi, kişisel öneriler vermez veya gelecekteki performansı garanti etmez.
Bu oluşturanın diğer ürünleri


Fiyat
Başlangıç 14/05/2025
10.1M
İşlem hacmi
81.44K
Kazanılan pip
201
Ücretsiz yüklemeler