Açıklama
⚠️ Taşındık 👉 PrimeQuant
🚫🚫🚫 Bu göstergeleri satın almayın!
Bu OHLC PRO by LudwigICT göstergesi, cTrader grafiğinizde profesyonel, bilgi açısından zengin bir görselleştirme sağlamak için tasarlanmış çok özellikli bir grafik üstü araçtır.
İşte yaptığı şeylerin bir dökümü:
🔹 Temel İşlev: OHLC Üstü
- Grafiğinizde özelleştirilmiş OHLC (Açılış, Yüksek, Düşük, Kapanış) çubukları çizer.
- Şunları ayarlayabilirsiniz:
-
- Hangi zaman dilimi OHLC kullanılacak (Günlük, Haftalık, Aylık veya H1, M15 gibi gün içi).
- Çubuk ofseti (mevcut mumlardan uzaklık).
- Çubuk genişliği, fitil, sınırlar ve özel renkler.
- Etkili olarak, “referans mumları” daha yüksek zaman dilimlerinden mevcut grafiğinize yerleştirilir.
🔹 Triple-M Kurulumu (Boğa/Ayı Sinyalleri)
- Ardışık daha yüksek dipler (boğa) veya daha düşük tepeler (ayı) desenini algılar.
- Algılandığında:
-
- Mumların üzerine üçgen simgeleri (yukarı veya aşağı) yerleştirebilir.
- Ayrıca çubukların rengini değiştirebilir ve momentum değişimini gösterebilir.
- Bu, momentum yapı değişikliği sinyali gibi davranır.
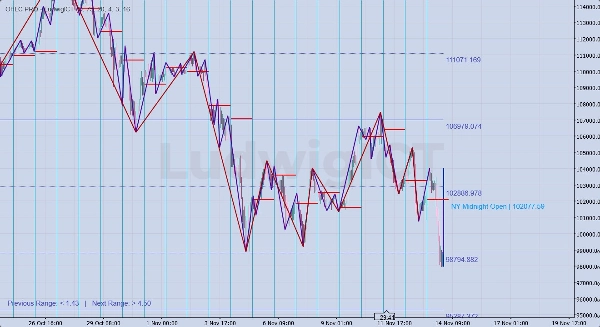
🔹 Çift ZigZag Araçları
- İki bağımsız ZigZag üstü:
-
- ZigZag #1 (daha uzun uzunluk, örn. salınım yapısı).
- ZigZag #2 (daha kısa uzunluk, örn. mikro salınımlar).
- Piyasa salınımlarını yapı, trend ve kırılma analizleri için vurgular.
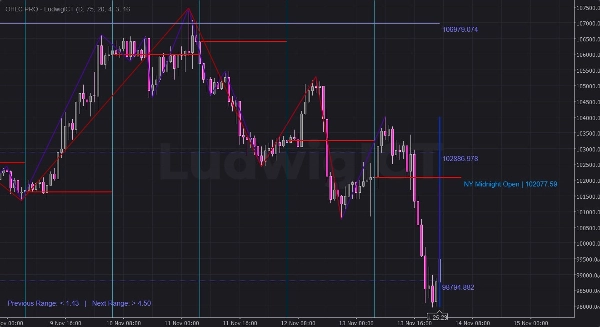
🔹 Gann Destek & Direnç
- S/R seviyelerini hesaplamak için Gann sayı tablosu + ATR mantığı kullanır.
- Fiyatın üstünde ve altında birden fazla destek/direnç çizgisi çizer.
- Çizgiler stilize edilebilir (düz, noktalı, sola uzatılmış vb.).
- Seviyeleri fiyat değerleriyle etiketler.
- Ayrıca Aralık Kılavuzları sağlar:
-
- ATR'ye göre “Önceki Aralık” ve “Sonraki Aralık”.
- Genişleme veya daralma bölgelerini tahmin etmeye yardımcı olur.
🔹 New York Gece Yarısı Seviyeleri
- Otomatik olarak New York Seansı gece yarısı açılış fiyatını algılar.
- Çizer:
-
- Yatay çizgi NY gece yarısı açılış fiyatında.
- Dikey çizgi seans başlangıcında.
- “NY Gece Yarısı Açılışı | fiyat” etiketleri gösterir.
- Bu çizgileri 1 veya 2 gün uzatabilir veya ekstra saat ekleyebilirsiniz.
- ICT tarzı ticaret için faydalıdır (New York seansı eğilimi, denge noktaları vb.).
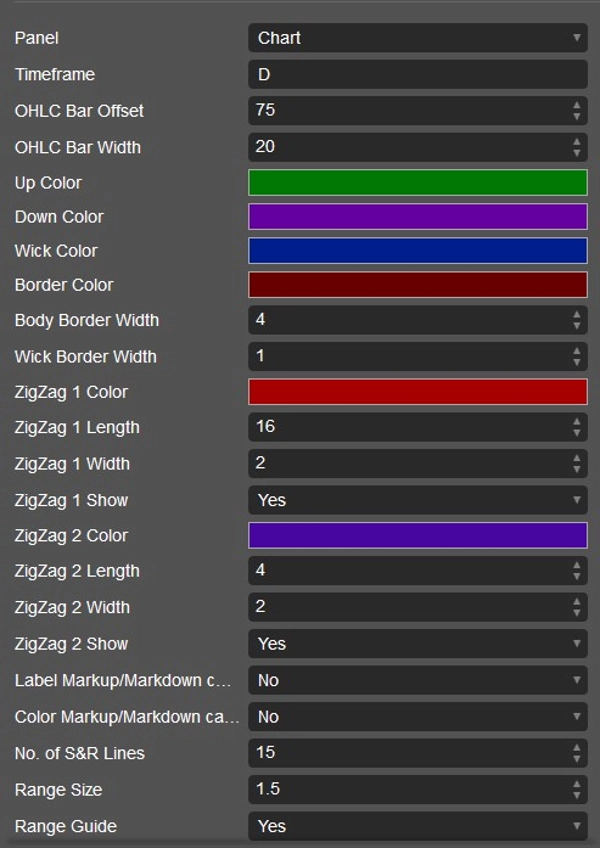
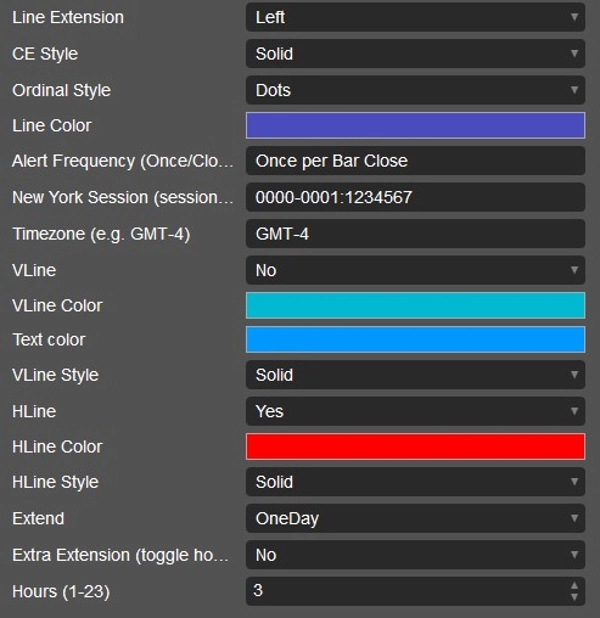
🔹 Özelleştirme & Uyarılar
- Her özellik için açılır menülerde parametreler vardır:
-
- Renkler, stiller, çizgi uzatmaları, çizgi sayısı vb.
- Uyarılar desteklenir (çoğunlukla grafik görselleriyle—uyarı sıklığı parametresi mevcuttur).
- Gösterge kapatıldığında temiz kaldırma yapılır (grafiğiniz karışık kalmaz).
✅ Kısaca:
Bu gösterge, çok amaçlı bir fiyat hareketi aracıdır. Şunları birleştirir:
- Daha yüksek zaman dilimi OHLC mumları
- Momentum desen sinyalleri (Triple-M)
- İki ZigZag yapısı
- Gann S/R seviyeleri + aralık kılavuzları
- New York seansı gece yarısı açılış işaretçileri
Özellikle ICT tarzı veya fiyat hareketi tüccarları için kullanışlı olan yapı, seans ve seviye bazlı ticaret için yapılmıştır.
XAU/USD ticaretinde pratik olarak nasıl kullanabileceğinizi açıklıyorum
🔹 Pratik Ticaret Kullanımı (OHLC PRO ile Altın)
1. Daha Yüksek Zaman Dilimi OHLC Üstü
- Örnek: M5/M15 üzerinde işlem yaparken Günlük OHLC çizin.
- Dünkü mumun “içinde” gün içi grafiğinizi göreceksiniz.
- Kullanımı:
-
- Fiyatın önceki günün yüksek/düşük seviyesine yaklaşması = likidite avı alanı.
- Günlük açılış/kapanış = eğilim filtresi (üstü = boğa, altı = ayı).
- Günlük aralık içinde işlem yapmanıza yardımcı olur.
👉 Altında, NY seansı genellikle önceki günün yüksek/düşüğüne saldırır ve sonra geri döner.
2. Triple-M Sinyalleri
- Triple-M deseni (artan dipler veya azalan tepeler dizisi) = kısa vadeli momentum.
- Kullanımı:
-
- HTF dip veya NY gece yarısı açılışında yakın boğa Triple-M → olası uzun scalp.
- HTF yüksek veya Gann seviyesinde yakın ayı Triple-M → olası kısa scalp.
- Hızlı altın hareketlerinde hızlı görsel tanıma için çubukların rengini değiştirebilir.
👉 HTF eğilimle hizalandığında M1–M5 üzerinde keskin nişancı girişleri için iyi çalışır.
3. Çift ZigZag
- ZigZag #1 (daha uzun) = salınım yapısı.
- ZigZag #2 (daha kısa) = mikro yapı.
- Kullanımı:
-
- Piyasa yapı kırılmalarını tanımlayın (BOS/CHOCH).
- Sadece daha büyük ZigZag (#1) yönünde işlem yapın.
- Giriş onayı için daha küçük ZigZag (#2) kullanın.
👉 Örnek: Günlük eğilim boğa → HTF destek yakınında ZigZag #2'nin boğa yönüne kaymasını bekleyin.
4. Gann Destek & Direnç
- Matematiksel S/R seviyeleri ızgarası oluşturur.
- Kullanımı:
-
- Fiyat konsolide oluyorsa, seviyeler muhtemel genişleme kırılma noktalarını işaretler.
- ATR aralık kılavuzu ile birleştirin:
-
- “Önceki Aralık” küçük → volatilite genişlemesi bekleyin.
- “Sonraki Aralık” yüksek → güçlü kırılma seviyesi yakında.
👉 Altında, Gann seviyeleri genellikle yuvarlak sayılarla hizalanır (örn. 2400, 2420, 2435).
5. New York Gece Yarısı Açılışı
- Altın için en güçlü ICT araçlarından biridir.
- Kullanımı:
-
- Fiyatın NY gece yarısı açılışına göre konumu = yön eğilimi.
- Fiyat gece yarısı açılışının üstünde kalırsa → boğa NY seansı.
- Altında ise → ayı eğilimi.
- Yatay çizgi denge (yüzde 50) referansı olarak işlev görür.
- Londra/NY killzone'larında bu seviye çevresinde likidite taramalarını izleyin.
👉 Örnek:
NY gece yarısı açılışı = 2405.
- Eğer Londra fiyatı 2398'e düşürür ve NY 2405'i geri alırsa → güçlü uzun kurulum.
🔑 Birleştirme (Örnek Kurulum)
- NY seansını başlatın:
-
- Günlük OHLC çizin.
- NY gece yarısı açılışını not edin.
- Yakındaki Gann seviyelerini izleyin.
- Likidite yakalama (Günlük Yüksek/Düşük veya Gann SR baskını) bekleyin.
- Micro boğa/ayı onayı için Triple-M / ZigZag #2 kontrol edin.
- Likidite taramasının arkasına stop koyarak giriş yapın.
- Aralığın karşı tarafını veya sonraki Gann/HTF seviyesini hedefleyin.
✅ Kısaca:
- Günlük OHLC + NY Gece Yarısı = eğilim filtresi.
- ZigZag + Triple-M = giriş zamanlaması.
- Gann + Aralık Kılavuzu = kar hedefleri ve genişleme sinyalleri.
Bu gösterge temel olarak size XAU/USD için tüm ICT tarzı araçları tek pakette sunar.
Herhangi bir sorunuz veya sorun yaşamanız durumunda benimle iletişime geçmekten çekinmeyin. Size yardımcı olmaktan mutluluk duyarım!
Feragatname:
Algoritmalarımı kullanarak, ticaretin doğasında riskler olduğunu ve geçmiş performansın gelecekteki sonuçları garanti etmediğini kabul etmiş olursunuz. Sağlam bir risk yönetimi stratejisine sahip olmanız ve özellikle stop-loss seviyelerine disiplinli bir şekilde uymanız çok önemlidir. Riskin doğru yönetilmemesi önemli kayıplara yol açabilir. Bu algoritmaların kullanımı sonucu oluşabilecek finansal sonuçlardan ben sorumlu değilim. Sorumlu bir şekilde işlem yapın ve her zaman uygun risk yönetimi uygulamalarını takip edin.
Hayırlı işler! 🙌
Özet
Müşteri değerlendirmeleri
5 | 100 % | |
4 | 0 % | |
3 | 0 % | |
2 | 0 % | |
1 | 0 % |


