Açıklama
Stop loss ve take profit seviyelerini ayarlamak için CRTIndicator kullanan bir cBot oluşturuldu.
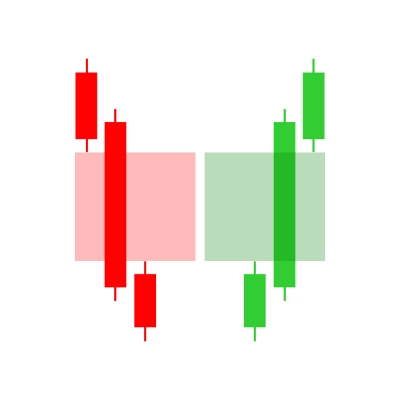
Fikir, yeni bir işlem için stop loss ve take profit seviyelerini ayarlamak üzere önceki bir mumun (CandleIndex ile belirtilen) CRT seviyelerini (yüksek, orta, düşük) kullanmaktır.
Adımlar:
- Bazı koşullara bağlı olarak (test için parametre olarak tanımlayacağımız) bir işlem açan (alım veya satım) bir cBot oluşturacağız.
- CRTIndicator'ı kullanarak önceki bir mumdan (mum indeksi kullanıcı tarafından ayarlanır) seviyeleri alacağız.
- Bir alım işlemi için, stop loss'u referans mumun CRT düşük seviyesine ve take profit'i CRT yüksek seviyesine ayarlayacağız.
- Bir satım işlemi için, stop loss'u referans mumun CRT yüksek seviyesine ve take profit'i CRT düşük seviyesine ayarlayacağız.
Ancak, sahip olduğumuz CRTIndicator sadece her mum için seviyeleri hesaplar ve çizer.
cBot'tan indikatöre erişip ilgilendiğimiz belirli mumun değerlerini almamız gerekiyor.
Haydi cBot'u tasarlayalım:
Parametreler:
- CandleIndex: hangi önceki mumun kullanılacağı (0 = mevcut, 1 = önceki, vb.)
- TradeType: test için Alış ve Satış arasında seçim yapmak üzere bir parametre ayarlayabiliriz veya karar vermek için bir sinyal (örneğin hareketli ortalama kesişimi) kullanabiliriz.
Basitlik için, işlem türünü seçmek üzere bir parametre yapalım.
Ama unutmayın: Canlı işlemde girmek için bazı koşullar kullanırız. Mevcut pozisyon yoksa, mevcut mumda işlem açan basit bir cBot yapacağız.
Grafiğin zaman diliminde işlem yaptığımızı varsayacağız.
cBot'taki adımlar:
- Açık bir pozisyonumuz olup olmadığını kontrol edin. Yoksa açmayı düşünün.
- Belirtilen CandleIndex için CRTIndicator değerlerini alın (bu, mevcut muma göre geçmiş bir mumdur).
- Bir Alış işlemi için:
Stop Loss = referans mumun CRT Düşük seviyesi
Take Profit = referans mumun CRT Yüksek seviyesi - Bir Satış işlemi için:
Stop Loss = referans mumun CRT Yüksek seviyesi
Take Profit = referans mumun CRT Düşük seviyesi
Ancak, indikatör her indeks için hesaplama yapar. Sabit CandleIndex ofseti kullandığımız için her indeks için aynı değerleri çiziyoruz.
Ama cBot'ta, belirtilen CandleIndex için mevcut zamanda (en son tamamlanmış mum) indikatörden seviyeleri almak istiyoruz.
Önemli: İndikatörün Calculate metodu her indeks için çağrılır ve referans mumun (indeks - CandleIndex) değerlerini mevcut indekste saklar.
Yani belirli bir tarihsel mum için CRT seviyelerini almak istiyorsak, indikatörün çıktı serisini o mumun indeksinde okuyabiliriz?
Ama unutmayın: indikatör çıktıları mevcut indeksle hizalanmıştır. Aslında, indikatör her bar için aynı değeri çiziyor çünkü şunu ayarlıyoruz:
CRTHigh[index] = crtHigh; // burada crtHigh, (index - CandleIndex) mumunun yüksek seviyesidir
Yani indeks 100'de ve CandleIndex=1 ise, 99. indeksin yüksek seviyesini alıyor ve bunu 100. indekste çiziyoruz.
Bu, CandleIndex mumlar önceki mumun CRT seviyelerini istiyorsak, mevcut bar (indeks) için indikatör çıktısını alabileceğimiz ve bunun CandleIndex mumlar önceki seviyeleri vereceği anlamına gelir.
Ama bekleyin, cBot'ta OnBar veya OnTick çalıştıracağız. En son tamamlanmış barla ilgileniyoruz (indeks = MarketSeries.Close.Count - 2) ve istediğimiz mum (mevcut indeks - CandleIndex).
Alternatif olarak, indikatörü referans mumla aynı indekste seviyeleri çıkartacak şekilde değiştirebiliriz, ancak o zaman çizimi CandleIndex kadar kaydırmamız gerekir.
Ancak mevcut indikatör, önceki mumdan mevcut bara seviyeleri çizmek üzere tasarlanmıştır. Yani CandleIndex=1 ayarlanırsa, her bar için önceki barın seviyelerini çiziyoruz.
Bunu cBot'ta nasıl kullanabiliriz:
İndikatörü cBot'a ekleyeceğiz ve sonra en son bar için (indeks = MarketSeries.Close.Count - 1) değerleri alacağız ve bu bize CandleIndex mumlar önceki seviyeleri verecek.
Örnek:
Mevcut bar indeksi = son bar (indeks = MarketSeries.Close.Count - 1)
Sonra bu indeksteki indikatör çıktısı (CRTHigh[MarketSeries.Close.Count-1]) (mevcut indeks - CandleIndex) barının yüksek seviyesidir.
Ama unutmayın: indikatörün Calculate metodu her tarihsel bar ve sonra her yeni bar için çağrılır. Böylece son bar için çıktı serisi istediğimiz değeri içerir.
Haydi cBot'u kodlayalım:
Parametrelerimiz olacak:
[Parameter("Candle Index", DefaultValue = 1, MinValue = 0)]
public int CandleIndex { get; set; }
[Parameter("Trade Type", DefaultValue = TradeType.Buy)]
public TradeType SelectedTradeType { get; set; }
[Parameter("Volume (Lots)", DefaultValue = 1, MinValue = 0.01, Step = 0.01)]
public double Volume { get; set; }
Ayrıca bir CRTIndicator örneği oluşturacağız.
OnBar'daki adımlar:
Pozisyon yoksa, mevcut bar için indikatör çıktısından (bu, CandleIndex mumlar önceki seviyelere karşılık gelir) alınan stop loss ve take profit ile yeni bir pozisyon açın.
Ancak, unutmayın: mevcut bar için indikatör çıktısı (son bar) (mevcut bar indeksi - CandleIndex) seviyelerine ayarlanmıştır. Ama çok başta olduğumuzda yeterli bar olduğundan emin olmalıyız.