
WAVETREND_withSourceCode
Gösterge
Sürüm 1.0, Oct 2025
Windows, Mac
5.0
Değerlendirmeler: 2
Açıklama
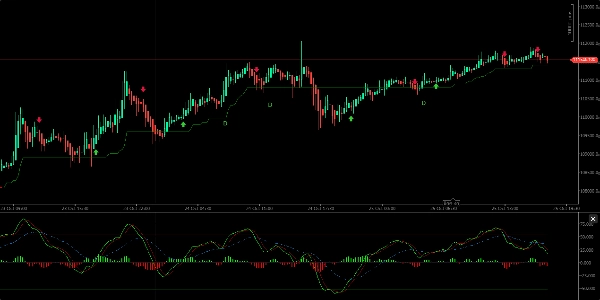
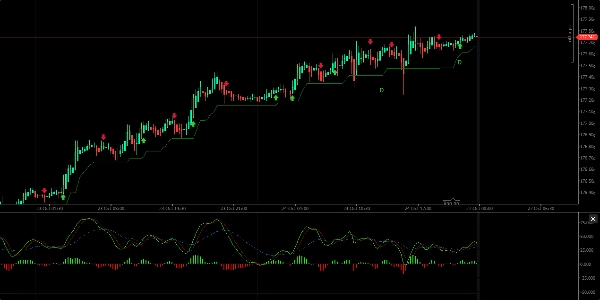
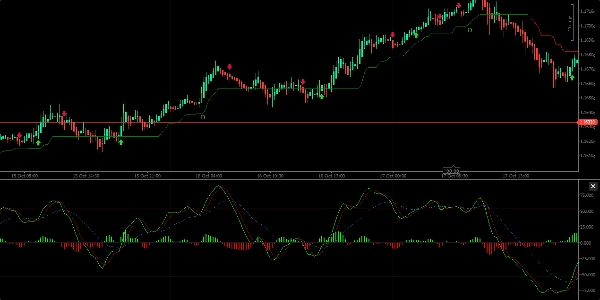
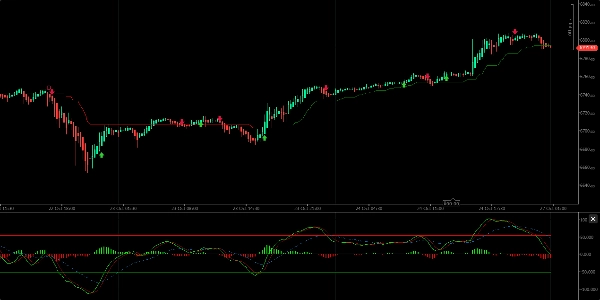
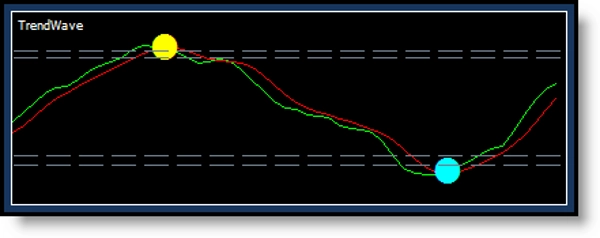
Alım-satım sinyalleri sağlar, trend yönü gösterir ve aşırı alım ve aşırı satım bölgelerini tanımlar. Görsel olarak, ortada bir bulut/histogram ile iki değer çizgisinden oluşur; bu bulut/histogram, yükselen veya düşen trendleri temsil eden bir orta çizginin üzerinde ve altında hareket eder.
Ana Özellikler:
- Alım sinyalleri, yeşil çizgi kırmızı çizgiyi yukarı doğru kestiğinde; satım sinyalleri ise yeşil çizgi aşağı doğru kestiğinde oluşur.
- Trend yönünü, orta çizginin üzerinde veya altında bulut dalgaları ile gösterir.
- Gösterge, kesişim noktalarında yeşil (alım) ve kırmızı (satım) noktalar gösterir ve buna karşılık gelen mum rengi değişiklikleri yapar (alım için sarı, satım için turkuaz).
- Aşırı kısa vadeli gürültüyü önlemek için en iyi 12 saatlik veya 1 günlük aralıklarda kullanılır.
- Gösterge, fiyat ve momentum arasındaki uyumsuzlukları (düzenli yükseliş ve düşüş uyumsuzlukları) tespit edebilir ve potansiyel fiyat dönüşlerini sinyaller.
- Daha güvenilir ticaret kararları için WaveTrend'in WMA, CMF, RSI ve MACD gibi diğer göstergelerle birleştirilmesi önerilir.
Genel olarak, WaveTrend trend yönünü ve ticaret sinyallerini tanımlamak için kullanışlı işlevsel bir araçtır ancak onay için diğer analiz araçlarıyla birlikte kullanılmalıdır.
Özet
Gösterge profili
Müşteri değerlendirmeleri
5.0
Değerlendirmeler: 2
5 | 100 % | |
4 | 0 % | |
3 | 0 % | |
2 | 0 % | |
1 | 0 % |
Müşteri değerlendirmeleri
November 6, 2025
the main upside is the trade idea gets slowed down first. The setup still needs say no.
Tartışma
SSS
Signal
ZigZag
EURUSD
Supertrend
GBPUSD
RSI
XAUUSD
NAS100
ATR
MACD
cTrader Store üzerinden erişilebilen işlem botları, göstergeler ve eklentiler gibi ürünler, üçüncü taraf sağlayıcılar tarafından sağlanır ve yalnızca bilgilendirme ve teknik erişim amaçlarıyla sunulur. cTrader Store bir broker değildir ve yatırım tavsiyesi, kişisel öneriler vermez veya gelecekteki performansı garanti etmez.


Fiyat
Başlangıç 16/03/2025
256
Ücretsiz yüklemeler