
Açıklama
Trend Entropy – Ücretsiz cTrader Göstergesi
Entropi, bir sistemdeki düzensizlik veya belirsizliğin bilimsel ölçüsüdür. Fizikte, enerjinin nasıl dağıldığını ve sistemlerin neden kaosa doğru hareket ettiğini gösterir. Bilgi teorisinde ise verideki tahmin edilemezliği ölçer. Düşük entropi düzen ve öngörülebilirlik anlamına gelirken, yüksek entropi rastgelelik, karmaşıklık ve sonuçların azalan netliğini yansıtır.
Kaos içindeki düzenin gücünü keşfedin. Trend Entropy, fiyat hareketlerinin organizasyonu ile rastgeleliği ölçmek için tasarlanmış ileri teknoloji bir teknik göstergedir. Sadece momentum veya volatiliteyi takip eden geleneksel osilatörlerin aksine, Trend Entropy gelişmiş entropi hesaplamaları uygulayarak piyasanın yapılandırılmış bir şekilde trend olup olmadığını ya da kaotik bir aralık davranışına mı sürüklendiğini ortaya koyar.
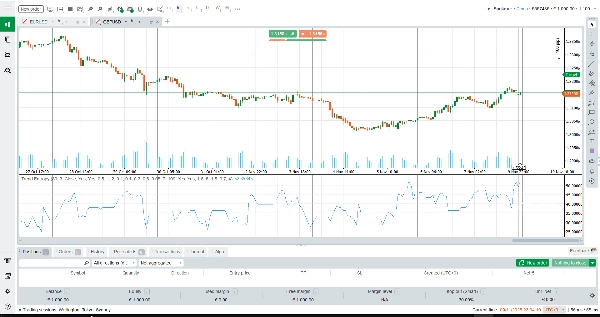
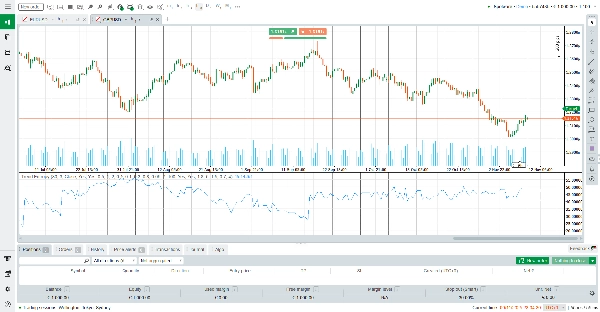
Bu ücretsiz araç, fiyat hareketlerinin gizli dinamiklerine daha derin bir bakış isteyen traderlar için geliştirilmiştir. İstatistiksel entropiyi RSI tarzı yumuşatma ve uyarlanabilir eşiklerle harmanlayarak, Trend Entropy ham volatiliteyi 0% ile 100% arasında net, normalize edilmiş bir ölçeğe dönüştürür. Sonuç, piyasanın güçlü bir trendde, nötr bir konsolidasyonda veya volatil bir aralıkta olup olmadığını size anlatan tek, zarif bir çizgidir.
Trend Entropy Nasıl Okunur
Düşük değerler (0–33%): Piyasa düzenlidir. Ortalama getiri pozitifse, muhtemel bir yükseliş trendi önerir. Negatifse, muhtemel bir düşüş trendini işaret eder.
Orta değerler (34–66%): Nötr bölge. Piyasa konsolide olabilir ve ortalama getiriye bağlı olarak hafifçe yükseliş veya düşüş eğiliminde olabilir.
Yüksek değerler (67–100%): Kaos hakimdir. Fiyat hareketi aralıktadır, tahmin edilemez ve trend takip stratejileri için daha az güvenilirdir.
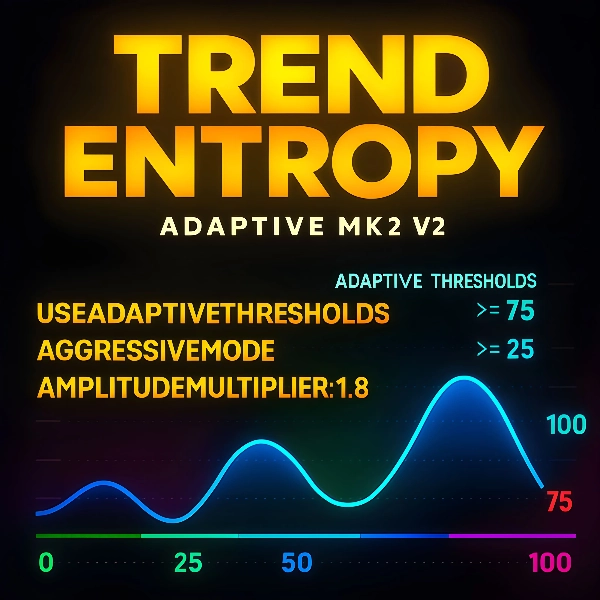
%25, %50 ve %75’teki yatay referans çizgileri yorumlamayı kolaylaştırır. Traderlar entropinin düzen yönünde sıkışıp sıkışmadığını veya kaos yönünde genişleyip genişlemediğini anında görebilir.
Göstergenin Çalışma Prensibi
Trend Entropy, seçilen bir dönemdeki getirileri hesaplar ve bunları sembolik durumlara dönüştürür. Bu durumlar, fiyat desenlerinin frekans dağılımını oluşturmak için örtüşen pencerelerde analiz edilir. Entropi matematiği kullanılarak, gösterge bu dizilerdeki düzensizlik derecesini ölçer.
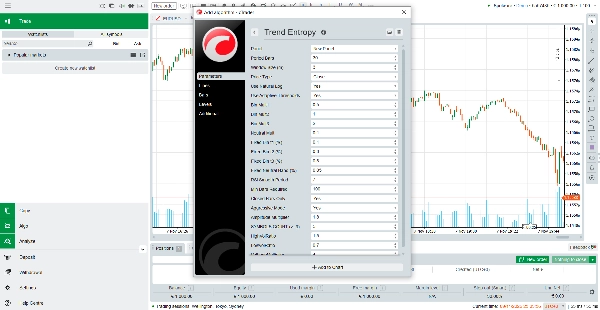
Çıktıyı pratik hale getirmek için ham entropi yüzde ölçeğine normalize edilir ve ardından Wilder tarzı ortalama yöntemiyle yumuşatılır. Uyarlanabilir eşikler göstergenin mevcut volatiliteye uyum sağlamasını sağlar, agresif mod ise daha keskin tepkiler tercih eden traderlar için sinyalleri güçlendirir. Son olarak, volatilite oranları uygulanarak okuma rafine edilir; kaotik koşullarda değerler yükseltilir, stabil koşullarda ise düşürülür.
Sonuç, piyasa yapısının özünü yakalayan tek bir yumuşatılmış çizgidir: fiyatın düzenli bir şekilde trend olup olmadığı veya rastgeleliğe doğru sürüklendiği.
Ana Özellikler
Entropi tabanlı analiz – Fiyat hareketinin gerçek organizasyonunu ölçmek için momentumun ötesine geçer.
Uyarlanabilir eşikler – Volatiliteye otomatik olarak uyum sağlar, sinyalleri tüm piyasa koşullarında geçerli tutar.
RSI tarzı yumuşatma – Gürültülü dalgalanmalardan kaçınan temiz, stabil bir çizgi sağlar.
Volatilite entegrasyonu – Kısa ve uzun vadeli volatilite oranlarını karşılaştırarak doğruluğu artırır.
Net görsel tasarım – Yatay referans seviyeleri ve tek bir DodgerBlue çizgisi yorumlamayı zahmetsiz hale getirir.
Neden Trend Entropy’yi Seçmelisiniz?
Trend Entropy sadece başka bir osilatör değildir. İstatistiksel titizlik ile trader dostu görselleştirmeyi birleştiren hibrit bir araçtır. İster onay arayan bir trend takipçisi olun, ister kaotik piyasalardan kaçınmak isteyen bir aralık traderı olun, bu gösterge size ihtiyacınız olan netliği sunar.
Özet
The indicator outputs a single smoothed line on a normalized scale from 0% to 100%, where low values (0–33%) indicate organized trending markets, mid values (34–66%) suggest neutral or consolidating conditions, and high values (67–100%) reflect chaotic, ranging markets. Horizontal reference lines at 25%, 50%, and 75% aid interpretation.
Trend Entropy pro incorporates RSI-style smoothing, adaptive thresholds that adjust to current volatility, and volatility ratio integration to enhance signal accuracy. It is designed to provide traders with deeper insight into market dynamics beyond traditional momentum or volatility indicators, supporting analysis across various markets including Forex, cryptocurrencies, commodities, indices, and stocks.
This indicator is suitable for traders seeking to identify trending versus ranging conditions and improve decision-making in trend-following or range-trading strategies.


