

Açıklama
SÜPER TREND OSİLATÖRÜ DENEME GÜNÜ15
"DİKKAT," ÜCRETLİ SÜRÜMLERDE ÜCRETSİZ 15 GÜNLÜK DENEME SÜRÜMÜ DE MEVCUTTUR" ücretli ürüne tıklayın ve ücretsiz sürümü bulacaksınız-
Basitleştirilmiş SuperTrend Osilatörü - Tam Açıklama
Genel Bakış
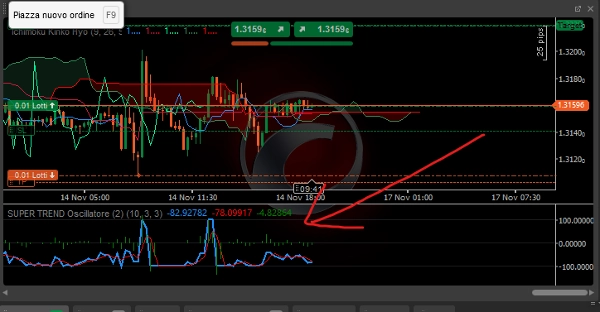
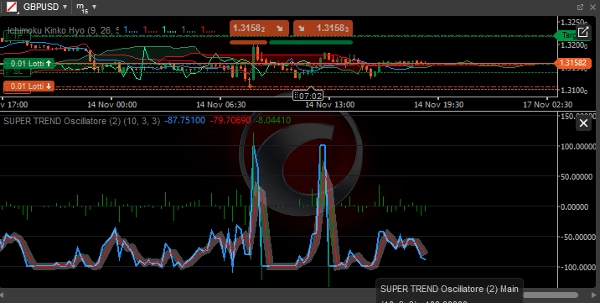
Basitleştirilmiş SuperTrend Osilatörü, klasik SuperTrend'i görsel bir osilatöre dönüştüren, trend yönünü, gücünü ve güvenilirliğini kolayca tanımlamayı sağlayan cTrader için gelişmiş bir teknik göstergedir.
Ana Bileşenler
1. Ana Hat (Mavi)
- Fonksiyon: Fiyat ile SuperTrend hattı arasındaki normalize edilmiş mesafeyi gösterir
- Hesaplama:
((Fiyat - SuperTrend) / (ATR × Çarpan)) × 100 - Yorumlama:
-
- > 0: Boğa trendi (fiyat SuperTrend'in üzerinde)
- < 0: Ayı trendi (fiyat SuperTrend'in altında)
- Aralık: -100 ile +100 arasında
2. Sinyal Hattı (Kırmızı)
- Fonksiyon: Ana hattın basit hareketli ortalaması
- Periyot: Özelleştirilebilir (varsayılan 3 periyot)
- Kullanım: Piyasa gürültüsünü filtreler ve sinyalleri doğrular
3. Histogram (Gri)
- Fonksiyon: Ana hat ile sinyal hattı arasındaki fark
- Yorumlama:
-
- Pozitif: Boğa momentumu hızlanıyor
- Negatif: Ayı momentumu hızlanıyor
- Sıfır kesişimi: Olası momentum dönüşleri
Yapılandırılabilir Parametreler
SuperTrend Parametreleri:
- ATR Periyodu: Ortalama Gerçek Aralık hesaplama periyodu (varsayılan: 10)
- Çarpan: SuperTrend bantları için çarpan (varsayılan: 3.0)
Osilatör Parametreleri:
- Sinyal Periyodu: Sinyal hattı için periyot (varsayılan: 3)
Sinyal Yorumlama
Trend Koşulları:
- Güçlü Boğa Trendi:
-
- Ana > +50
- Ana > Sinyal
- Pozitif histogram
- Güçlü Ayı Trendi:
-
- Ana < -50
- Ana < Sinyal
- Negatif histogram
- Aralıklı Piyasa:
-
- Ana -30 ile +30 arasında
- Sık sık hat kesişimleri
Alım Satım Sinyalleri:
Uzun Pozisyon Girişi:
- Ana 0'ın üzerine çıkar
- Histogram pozitif olur
- Sinyal hattı boğa trendini onaylar
- Momentum için Ana +20'nin üzerinde
Kısa Pozisyon Girişi:
- Ana 0'ın altına iner
- Histogram negatif olur
- Sinyal hattı ayı trendini onaylar
- Momentum için Ana -20'nin altında
Çıkış/Kâr Al:
- Uzun: Ana > +80 (aşırı alım) veya Sinyal hattının altına kesiş
- Kısa: Ana < -80 (aşırı satım) veya Sinyal hattının üzerine kesiş
Basitleştirilmiş Sürümün Avantajları
1. Optimize Edilmiş Performans
- Daha verimli hesaplamalar
- Daha düşük kaynak tüketimi
- Fiyat değişikliklerine daha hızlı tepki
2. Kullanım Kolaylığı
- Azaltılmış temel parametreler
- Anında görsel sinyaller
- Yeni başlayanlar için bile kolay yorumlama
3. Güvenilirlik
- Gürültüye karşı daha az hassas
- Daha temiz ve belirgin sinyaller
- Klasik SuperTrend'e kıyasla azalan yanlış sinyaller
Kullanım Stratejileri
Trend Takip Stratejisi:
- Giriş: Uzun için Ana > 0, kısa için Ana < 0
- Filtre: Histogram Ana ile aynı işaret
- Çıkış: İşaret değişimi veya aşırı seviyelere ulaşılması
Momentum Stratejisi:
- Giriş: Uzun için Ana > +30 veya kısa için Ana < -30
- Onay: Histogram hızlanıyor
- Çıkış: Momentum yavaşlaması (histogram azalıyor)
Ortalama Dönüş Stratejisi:
- Giriş: Kısa için Ana > +80 veya uzun için Ana < -80
- Onay: Histogram dönüşü
- Çıkış: Nötr bölgeye dönüş
Optimal Piyasa Koşulları
Trend Piyasaları:
- Yüksek verimlilik
- Uzun süreli sinyaller
- Daha az yanlış sinyal
Aralıklı Piyasalar:
- Lot büyüklüğünü azaltın
- Zaman dilimini uzatın
- Momentum filtresi olarak kullanın
En İyi Uygulamalar
Önerilen Zaman Dilimleri:
- Gün içi: M15 - H1
- Swing Trading: H4 - D1
- Pozisyon Trading: W1 - MN
Risk Yönetimi:
- Stop Loss: 1.5-2 × ATR
- Kâr Al: 2-3 × Risk
- Pozisyon Büyüklüğü: İşlem başına %1-2
Ek Onaylar:
- Çoklu zaman dilimi uyumu
- Hacim onayı
- Ana destek/direnç seviyeleri
Sınırlamalar
Dikkat Edilmesi Gerekenler:
- Doğal gecikme (trend takip göstergesi)
- Aralıklı piyasalarda azalan performans
- Düşük volatilitede onay ihtiyacı
Öneriler:
- Fiyat hareketi analizleri ile birleştirin
- Bağımsız sistem değil, filtre olarak kullanın
- Canlı kullanımdan önce demo testi yapın
Bu osilatör, güçlü trendleri tanımlamak ve yanlış sinyalleri filtrelemek için güçlü bir araç olup, hem yeni başlayanlar hem de deneyimli traderlar için uygun operasyonel sadeliği korur.
Özet
Müşteri değerlendirmeleri
5 | 0 % | |
4 | 100 % | |
3 | 0 % | |
2 | 0 % | |
1 | 0 % |


!["[Stellar Strategies] Smart ADX" logosu](https://cdn.ctrader.com/image/webp/af13b084-b6f6-41db-b7bc-c7e688b57b05_36929)

