Deskripsi
Peta Panas Likuiditas - Analisis Pivot Multi-Timeframe Profesional
Ubah cara trading Anda dengan visualisasi likuiditas canggih. Indikator kuat ini mengungkap zona likuiditas institusional dengan menganalisis titik pivot di 10 timeframe berbeda secara bersamaan, menciptakan peta panas dinamis yang menunjukkan dengan tepat di mana uang pintar kemungkinan besar berada.
Cara Kerjanya
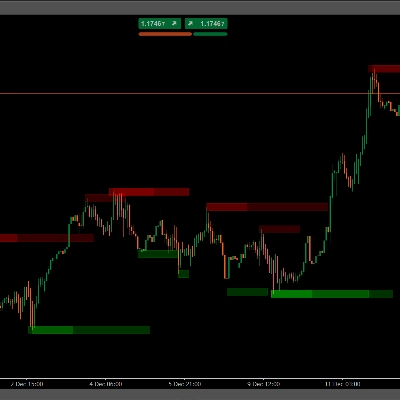
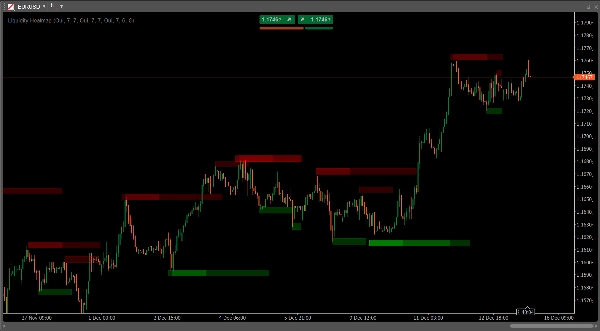
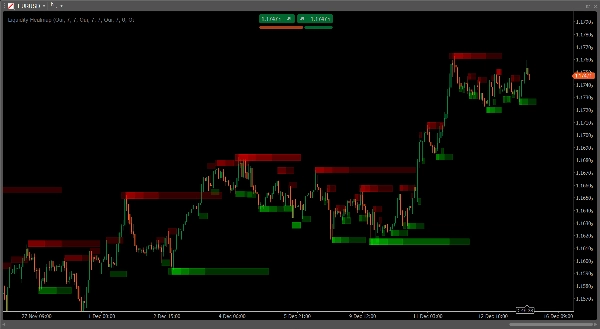
Indikator mendeteksi pivot tertinggi dan terendah pada beberapa timeframe (15menit, 30menit, 1J, 2J, 4J, Harian, 8J, 3H, Mingguan, Bulanan) dan menumpangkan zona semi-transparan pada setiap level pivot. Di mana beberapa pivot dari timeframe berbeda bertemu, zona-zona tersebut menumpuk dan warnanya menguat, menciptakan "tanda panas" yang mengungkap level likuiditas terkuat pada grafik Anda.
Fitur Utama
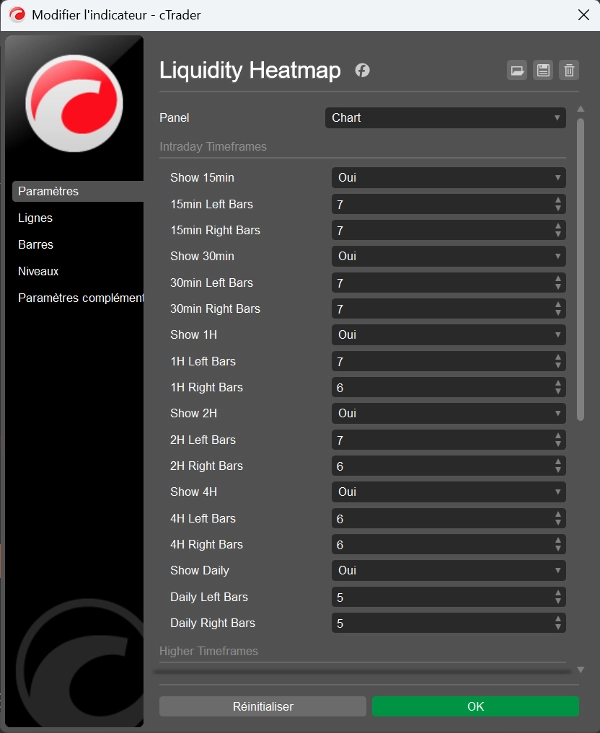
- 10 Timeframe yang Dapat Disesuaikan: Menganalisis dari intraday (15menit) hingga perspektif jangka panjang (Bulanan) secara bersamaan
- Pemetaan Kepadatan Cerdas: Zona yang tumpang tindih secara otomatis menciptakan area yang lebih gelap yang menunjukkan konfluensi likuiditas
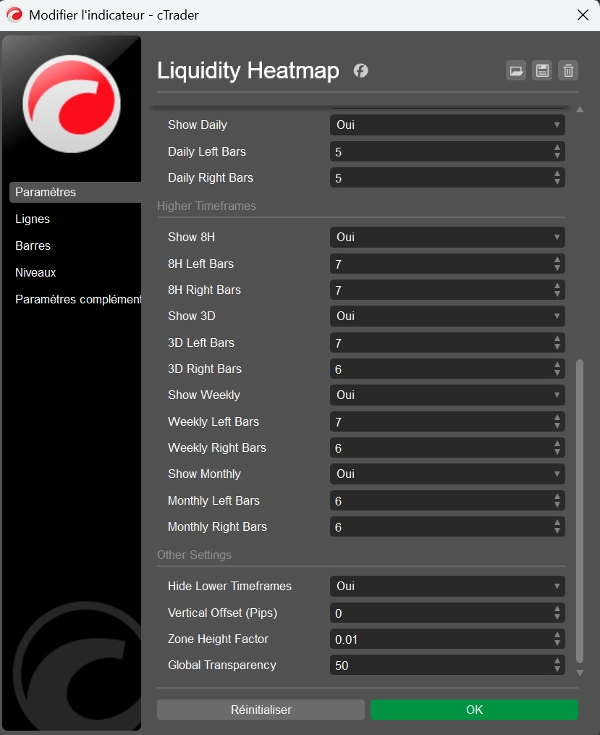
- Deteksi Pivot yang Sepenuhnya Dapat Disesuaikan: Konfigurasikan bar kiri/kanan (2-20) untuk setiap timeframe secara independen
- Visualisasi Adaptif: Tinggi zona secara otomatis menyesuaikan dengan zoom grafik untuk tampilan yang konsisten
- Zona Berjangkar Waktu: Zona tetap pada waktu pembentukannya yang tepat, tidak pernah bergeser pada grafik Anda
- Transparansi yang Dapat Disesuaikan: Kontrol transparansi global (0-255) sesuai gaya grafik Anda
- Penyaringan Timeframe Cerdas: Opsi untuk menyembunyikan timeframe yang lebih rendah berdasarkan tampilan grafik Anda saat ini
- Kontrol Offset Vertikal: Sesuaikan posisi zona dengan penyesuaian berbasis pip
- Pengkodean Warna Terpisah: Zona merah untuk pivot tertinggi (resistensi), hijau untuk pivot terendah (dukungan)
Cocok Untuk
- Trader Konsep Uang Pintar (SMC) yang mengidentifikasi kolam likuiditas
- Pengikut metodologi ICT yang melacak level institusional
- Trader swing yang mencari zona pembalikan dengan probabilitas tinggi
- Scalper yang mengidentifikasi pengambilan likuiditas intraday
- Trader mana pun yang mencari konfluensi di berbagai timeframe
Aplikasi Trading
Peta panas mengungkap di mana stop loss berkumpul dan di mana kemungkinan besar order institusional berada. Gunakan zona-zona ini untuk:
- Mengantisipasi sapuan likuiditas dan pembalikan
- Mengidentifikasi konfluensi support/resistance yang kuat
- Menemukan titik masuk optimal setelah pengambilan likuiditas
- Menetapkan stop loss strategis di luar zona likuiditas utama
- Mengonfirmasi validitas breakout dengan mengamati konsumsi likuiditas
Mengapa Indikator Ini Menonjol
Berbeda dengan indikator pivot dasar yang hanya menunjukkan level timeframe tunggal, peta panas ini menggabungkan data dari 10 timeframe secara bersamaan, memberi Anda pandangan menyeluruh tentang struktur pasar. Visualisasi kepadatan langsung menunjukkan level mana yang paling signifikan - semakin gelap zonanya, semakin banyak timeframe yang setuju pada level likuiditas tersebut.
Performa Dioptimalkan
Memproses hingga 500 bar per timeframe secara efisien dengan manajemen objek cerdas, memastikan kinerja grafik yang lancar bahkan dengan semua timeframe diaktifkan.
Pengaturan Mudah
Pasang dan mulai trading segera dengan pengaturan default yang dioptimalkan, atau sesuaikan setiap parameter agar sesuai dengan strategi dan gaya trading spesifik Anda.
Tingkatkan analisis likuiditas Anda dan trading dengan wawasan aliran order institusional. Sempurna untuk trader yang memahami bahwa harga tidak bergerak secara acak - harga bergerak menuju likuiditas.
Ringkasan
Key features include customizable pivot detection parameters for each timeframe, adaptive zone visualization that scales with chart zoom, and separate color coding for resistance (red) and support (green) zones. The indicator also offers adjustable transparency, vertical offset control, and smart timeframe filtering to hide lower timeframes based on the current chart view.
This tool is suitable for traders using Smart Money Concepts, ICT methodology, swing trading, scalping, or any strategy requiring multi-timeframe liquidity analysis. It helps identify clusters of stop losses and institutional orders to anticipate liquidity sweeps, reversals, strong support/resistance levels, optimal entry points, strategic stop losses, and breakout confirmations.
Liquidity Heatmap efficiently processes up to 500 bars per timeframe with optimized object management, ensuring smooth performance. It supports various markets including Forex, Crypto, Stocks, Indices, and Commodities. The indicator comes with optimized default settings and full customization options to fit different trading styles.
Ulasan pelanggan
5 | 100 % | |
4 | 0 % | |
3 | 0 % | |
2 | 0 % | |
1 | 0 % |


