Opis
Krawędź ważona wolumenem: Kompletny przewodnik po momentum cTrader
Standardowe wskaźniki pokazują, gdzie cena była. Wskaźnik Volume-Weighted RSI Candles pokazuje przekonanie stojące za ruchem. Łącząc akcję cenową, wolumen ticków i pięć kluczowych poziomów instytucjonalnych, to narzędzie przekształca RSI z prostego oscylatora w kompleksowy system mapowania trendów.
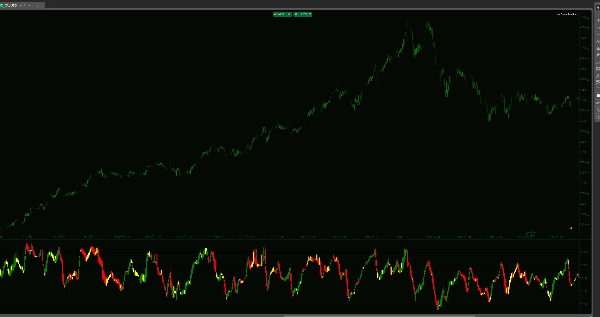
Zamiast pojedynczej linii otrzymujesz pełne świece OHLC w oknie wskaźnika. Pozwala to zobaczyć "strukturę" momentum — ujawniając, czy ruch jest wspierany przez duży wolumen instytucjonalny, czy jest po prostu niskopłynnościowym "fałszywym wybiciem".
Strategia wykonania 5-strefowego
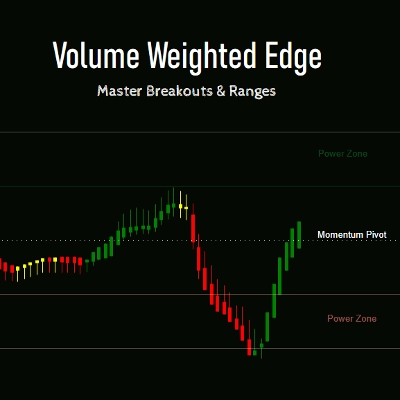
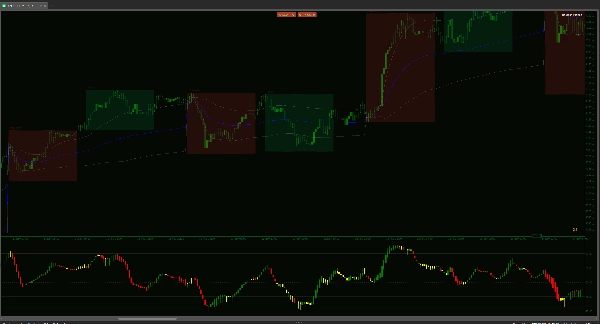
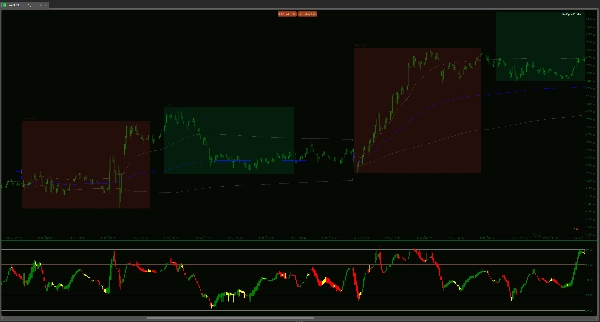
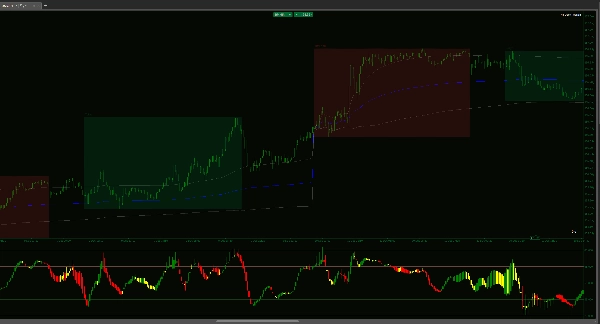
- Power Extensions (65–80 & 20–35): To są strefy o wysokim przekonaniu. Gdy świece ważone wolumenem utrzymują się tutaj, nie szukasz odwróceń — podążasz za trendem. To miejsce działania dużych pieniędzy i gdzie zachodzą najbardziej wybuchowe ruchy.
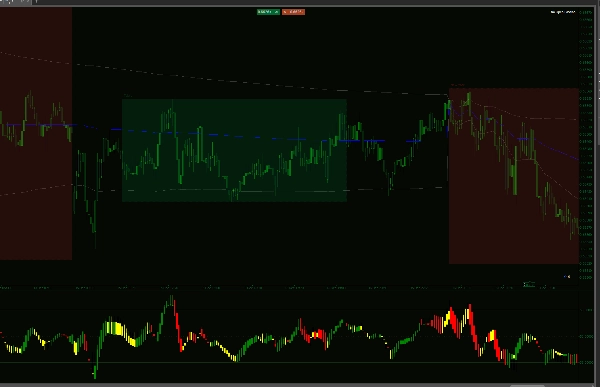
- Scalping Corridors (50–65 & 35–50): Idealne na sesję azjatycką lub rynki w konsolidacji. Gdy trend na wyższym interwale jest neutralny, te strefy dostarczają wysokoprawdopodobnych celów "powrotu do średniej". Jeśli rynek konsoliduje, te korytarze pozwalają na precyzyjne skalpowanie rotacji.
- Momentum Pivot (50): Ostateczna linia na piasku. Zamknięcie korpusu świecy ważonej wolumenem powyżej tego poziomu to pierwsze ostrzeżenie o strukturalnej zmianie kontroli rynku.
Dlaczego to narzędzie zmienia Twój sposób pracy
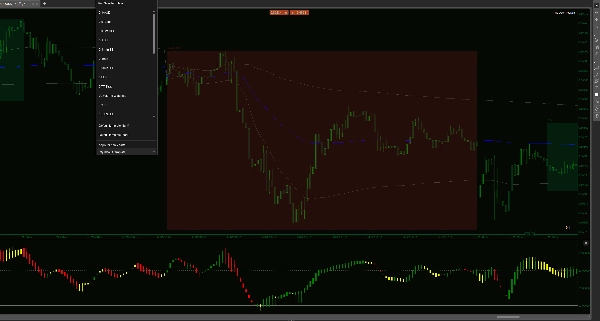
Jasność ważona wolumenem: Każda świeca jest obliczana przez mnożenie zmiany ceny przez wolumen ticków. Jeśli ruch następuje przy niskim wolumenie, świeca RSI tego nie potwierdzi. Chroni to przed "pułapkami" ruchów, które wyglądają dobrze na wykresie cenowym, ale nie mają wsparcia.
Wgląd w korpus świecy: Tradycyjne linie RSI są nerwowe i poszarpane. Nasze świece wygładzone WMA pokazują "otwarcie" i "zamknięcie" momentum. Jeśli korpus świecy RSI jest gruby i solidny, trend jest zdrowy. Jeśli knoty są długie, momentum jest wyczerpane.
Wszechstronność wielorynkowa: * Trendujące: Używaj zakresu 65–80, aby dłużej pozostawać w wygrywających transakcjach.
Konsolidacja/skalpowanie: Używaj korytarzy 35–65, aby łapać szybkie rotacje podczas sesji o niższej zmienności, takich jak Azja.
Unikaj pułapki "Kod kreskowy": Większość wskaźników zmusza do zgadywania podczas okresów niskiej zmienności. Ten wskaźnik posiada unikalny wizualny efekt "Kod kreskowy" podczas konsolidacji. Gdy świece się zwężają, spłaszczają i stają się neutralne, wskaźnik informuje, że "silnik rynku" jest wyłączony. To wizualne ostrzeżenie chroni przed wejściem w niskowolumenowe fałszywki i rozdrabnianiem się, gdy za ruchem cen nie stoi prawdziwy kapitał.
Natychmiastowa optymalizacja cTrader: Zbudowany specjalnie dla API C# z logiką "Max Visual Candles", aby zapewnić płynność działania platformy, nawet na wykresach minutowych.
Przestań handlować na podstawie tego, gdzie rynek może się udać. Zacznij handlować na podstawie tego, gdzie wolumen faktycznie go popycha. Ten wskaźnik to nie tylko sygnały — to zrozumienie wewnętrznej energii rynku.
Podsumowanie
Opinie klientów
5 | 33 % | |
4 | 67 % | |
3 | 0 % | |
2 | 0 % | |
1 | 0 % |


