
Açıklama
LogicLadder Pivots – Gelişmiş Piyasa Yapısı ve Desen Tarayıcı
LogicLadder Pivots ile piyasanın gizli yapısını açığa çıkarın.
LogicLadder Pivots göstergesi, tüccarların piyasa yapısını görselleştirmesine, trendleri tanımlamasına ve yüksek olasılıklı dönüş desenlerini otomatik olarak tespit etmesine yardımcı olmak için tasarlanmış profesyonel düzeyde bir fiyat hareketi aracıdır. Klasik ZigZag mantığını gelişmiş çok zaman dilimli izleme ile birleştirerek, bu araç kişisel piyasa analistiniz gibi çalışır, grafiklerinizi temiz tutarken kritik fiyat hareketleri hakkında sizi uyarır.
🚀 Temel Özellikler
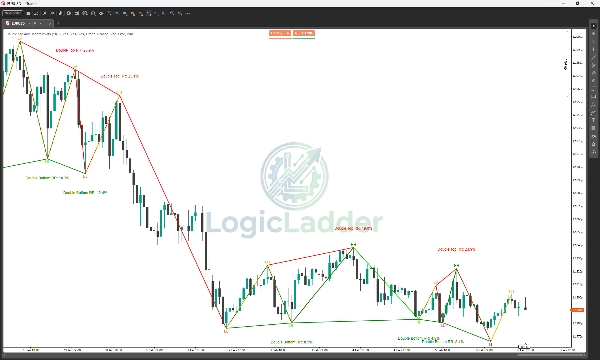
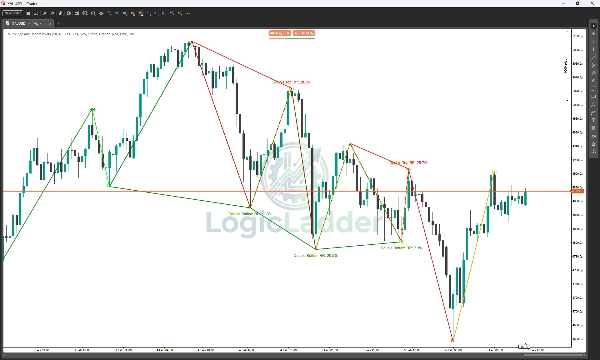
- Otomatik Piyasa Yapısı: Otomatik olarak Yüksek Tepeler (HH), Düşük Tepeler (LH), Yüksek Dipler (HL) ve Düşük Dipler (LL) etiketler, size mevcut trend yönü hakkında anlık bilgi verir.
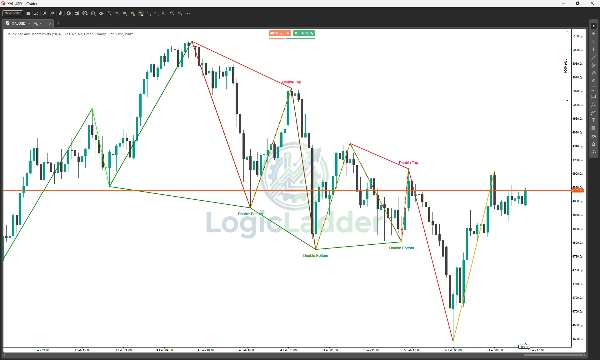
- Akıllı Desen Tespiti: Gerçek zamanlı olarak Çift Tepe ve Çift Dip oluşumlarını tarar. Sadece desenleri bulmakla kalmaz; hesaplanan Risk-Getiri (RR) oranına göre filtreleyerek size en uygulanabilir kurulumları gösterir.
- Çok Zaman Dilimli (MTF) Uyarılar: Daha yüksek bir zaman dilimini (örneğin, H4 veya Günlük) izlerken daha düşük bir zaman diliminde işlem yapın. Gösterge, izleme zaman diliminizde önemli pivotlar oluştuğunda sizi uyarır, böylece ana trende karşı işlem yapmazsınız.
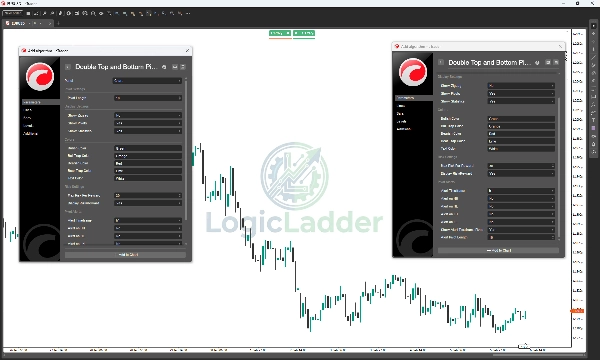
- Etkileşimli İstatistik Paneli: Temiz, grafik üzerinde bir gösterge paneli desen tespitinin mevcut durumunu (Tarama, Çift Tepe Tespit Edildi vb.) gösterir.
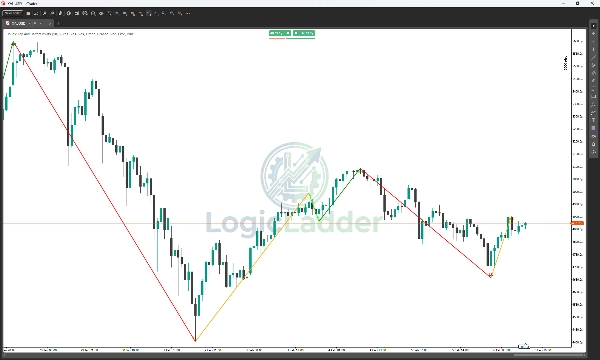
- ZigZag Görselleştirme: Gürültüyü kesen, net ve özelleştirilebilir trend çizgileri çizer, böylece önemli fiyat dalgalanmalarına odaklanmanıza yardımcı olur.
- Tamamen Özelleştirilebilir: Göstergenin her yönünü işlem tarzınıza göre ayarlayın. Pivot hassasiyetini (Uzunluk) değiştirin, Boğa/Ayı yapıları için renkleri değiştirin ve farklı görsel öğeleri açıp kapatın.
🎨 Görsel Rehber ve Renk Stratejisi
LogicLadder sistemi, piyasa yapısının hikayesini anında anlatmak için özel bir 4 renk kodu kullanır. İşte "Ladder" nasıl okunur:
1. 🟢 Yeşil (Boğa - Güçlü)
- Nedir: Yüksek Tepeler (HH) için kullanılır.
- Anlamı: Alıcılar tamamen kontrolü ele almıştır. Piyasa yeni zirveler yapıyor.
- Eylem: Alım fırsatları arayın veya mevcut uzun pozisyonları koruyun.
2. 🔴 Kırmızı (Ayı - Güçlü)
- Nedir: Düşük Dipler (LL) için kullanılır.
- Anlamı: Satıcılar tamamen kontrolü ele almıştır. Piyasa yeni dip seviyelere düşüyor.
- Eylem: Satış fırsatları arayın veya mevcut kısa pozisyonları koruyun.
3. 🟠 Turuncu (Boğa Tuzağı - Zayıflık)
- Nedir: Düşük Tepeler (LH) için kullanılır.
- Anlamı: Alıcılar fiyatı yukarı itmeye çalıştı ancak önceki yüksek seviyeyi kıramadı. Bu bir "Boğa Tuzağı"dır—geciken alıcılar momentum azaldıkça tuzağa düşer.
- Eylem: Uyarı işareti! Uzun pozisyondaysanız kar almayı düşünün. Aşağı yönlü olası bir trend dönüşüne dikkat edin.
4. 🟢 Lime (Ayı Tuzağı - Güç)
- Nedir: Yüksek Dipler (HL) için kullanılır.
- Anlamı: Satıcılar fiyatı aşağı itmeye çalıştı ancak önceki düşük seviyeyi kıramadı. Bu bir "Ayı Tuzağı"dır—geciken satıcılar destek tuttuğu için tuzağa düşer.
- Eylem: Fırsat işareti! Bu genellikle yeni bir yükseliş trendinin başlangıcını işaret eder. Uzun pozisyon için giriş sinyallerine dikkat edin.
📉 "Ladder" Nasıl İşlem Yapılır
- Yükseliş Modu: Yeşil (HH) ile Lime (HL) bağlantılı bir desen görmek istersiniz. Bu sağlıklı yükselen bir merdiveni doğrular.
- Düşüş Modu: Kırmızı (LL) ile Turuncu (LH) bağlantılı bir desen görmek istersiniz. Bu dik düşen bir merdiveni doğrular.
- Dönüş Tespiti:
-
- Olası Tepe: Eğer hemen ardından Turuncu (LH) gelen bir Yeşil (HH) görürseniz, yükseliş trendi enerjisini kaybediyor demektir.
- Olası Dip: Eğer hemen ardından Lime (HL) gelen bir Kırmızı (LL) görürseniz, satış baskısı tükenmiş demektir.
💡 Nasıl Çalışır
- Pivot Analizi: Gösterge, önemli salınım yüksekleri ve düşüklerini belirlemek için kullanıcı tarafından tanımlanan bir geriye dönük dönemi (varsayılan: 10 bar) analiz eder.
- Trend Mantığı: Bu noktaları bağlayarak fiyatın "Merdiven"ini görselleştirir—bir trendin yapısını kırdığı veya destek/direnci saygı gösterdiği anı size tam olarak gösterir.
- Dönüş Onayı: Fiyat hareketi, Risk/Getiri kriterlerinize uyan bir "W" (Çift Dip) veya "M" (Çift Tepe) yapısı oluşturduğunda, gösterge deseni grafikte çizer ve durum panelini günceller.
🔔 Uyarılar ve Bildirimler
Ekrana bakmadan haberdar olun. LogicLadder Pivots sağlam bir uyarı sistemi içerir:
- Kayıt Uyarıları: Desenler veya pivotlar oluştuğunda cTrader kaydına ayrıntılı mesajlar yazdırılır.
- MTF İzleme: Seçilen uyarı zaman diliminde (örneğin, 5 Dakikalık grafikte skala yaparken 4 Saatlik Pivot Düşük için uyarı alın) yapısal bir Pivot Yüksek veya Düşük oluştuğunda bildirim alın.
⚙️ Parametreler
- Pivot Uzunluğu: Salınım tespitinin hassasiyeti.
- Etiket Ofseti: Metin etiketlerinin mum fitillerinden uzaklığını daha iyi görünürlük için ayarlayın.
- Maksimum Risk Getiri Oranı: Verimliliğe göre desenleri filtreleyin (varsayılan: %30).
- Uyarı Zaman Dilimi: İzlemek için ikincil bir zaman dilimi seçin.
- Görsel Ayarlar: Boğa, Ayı ve Tuzak hareketleri için renkler üzerinde tam kontrol.
Özet
The indicator detects Double Top and Double Bottom reversal patterns in real-time, filtering them by a calculated Risk-to-Reward ratio to highlight the most actionable setups. It supports alerts for pivot formations on higher timeframes while trading on lower ones, helping users align trades with major trends.
A customizable on-chart stats panel displays the current pattern detection status, and clear ZigZag trend lines visualize significant price swings. Users can adjust pivot sensitivity, label positioning, and color schemes for bullish, bearish, and trap moves to fit their trading style.
The tool employs a four-color system to represent market conditions: green for strong bullish moves (HH), red for strong bearish moves (LL), orange for bull traps (LH), and lime for bear traps (HL). This visual guide aids in spotting trend continuations and potential reversals. Alerts include detailed log messages and MTF notifications to keep traders informed.


!["Smart Money Concepts (SMC) [Iridio Capital]" logosu](https://cdn.ctrader.com/image/webp/28b69fd1-ef54-4bed-9487-07e78e883be4_40934)


!["[Hamster-Coder] Moving Average MTF" logosu](https://cdn.ctrader.com/image/webp/b11b98b1-194d-4b8e-b00e-d611826ad159_31226)


