
E7 Polynomial Regression Channel
Индикатор
889 скачивания
Версия 1.0, Feb 2025
Windows, Mac
4.8
Отзывы: 5
Описание
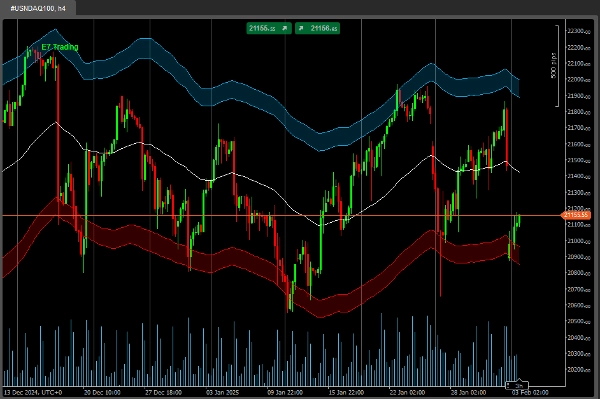
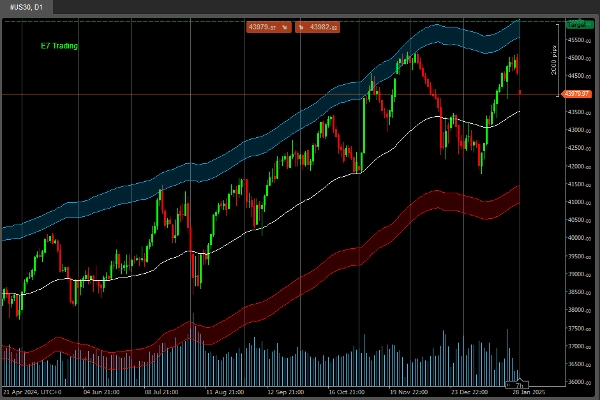
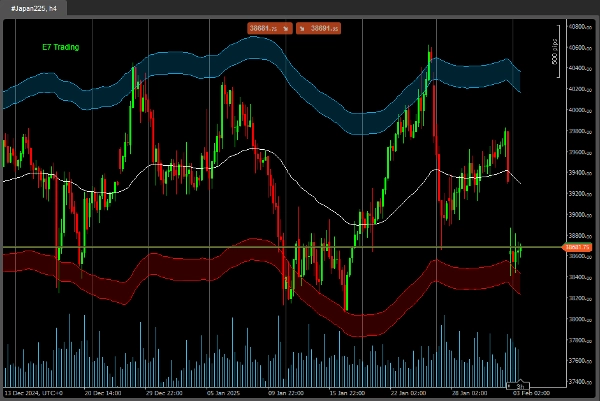
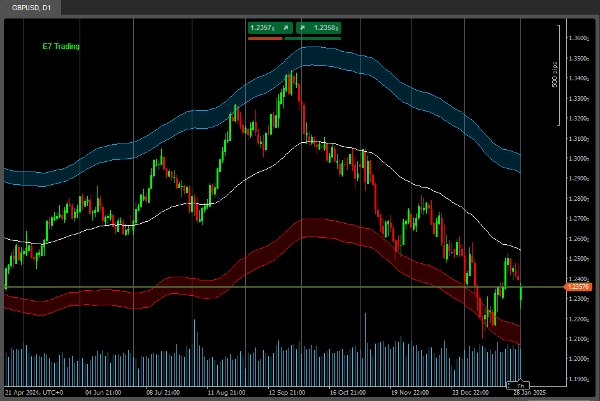
Это настроенный канал полиномиальной регрессии.
Он также отражает волатильность базового актива.
Это позволяет проводить лучший анализ, как обучают в стратегиях E7.
Удачной охоты!
Сводка
ИИ-сводка
The E7 Polynomial Regression Channel is a customized technical indicator designed for market analysis. It applies polynomial regression to price data, creating a channel that adapts to the underlying asset's price movements. This channel also incorporates volatility measures, allowing users to assess market conditions more comprehensively. By reflecting both trend and volatility, it supports enhanced analysis consistent with the methodologies taught in the E7 Strategies. The indicator is intended for use in trading platforms to assist traders in identifying potential price channels and volatility shifts.
Профиль индикатора
Отзывы покупателей
4.8
Отзывы: 5
5 | 80 % | |
4 | 20 % | |
3 | 0 % | |
2 | 0 % | |
1 | 0 % |
Отзывы покупателей
July 14, 2025
Pros: Polynomial regression with adjustable degree and deviation channels. Great for identifying trend zones and reversals. Works across timeframes. Cons: No alerts or tooltips. High polynomial degrees may cause lag. Lacks template saving for user settings.
May 1, 2025
This is very good Mate, i really like it, i am working o an Cbot with few indicators, could you share me this one code to include it?
Обсуждение
Частые вопросы
Продукты, доступные в cTrader Store, включая торговых ботов, индикаторы и плагины, предоставляются сторонними разработчиками и доступны исключительно в информационных и технических целях. cTrader Store не является брокером и не предоставляет инвестиционные консультации, персональные рекомендации или какие-либо гарантии будущей доходности.
Больше от этого автора


![Логотип продукта "Gaussian Channel [Iridio Capital]"](https://cdn.ctrader.com/image/webp/7c039209-5573-4a54-a072-f9528b503103_41960)


Цена
С 18/12/2024
2
Продажи
4.25K
Бесплатные установки