Açıklama
Öz Yinelemeli Değer Göstergesi
Genel Bakış
Öz Yinelemeli Değer, içsel piyasa trendlerini belirlemek için birden çok dönem boyunca yinelemeli göreceli güç hesaplamalarını kullanan özel bir göstergedir. Trend gücünün kritik bir seviyeye ulaştığı önemli fiyat seviyelerini belirler ve potansiyel dönüşler ile trend onayları hakkında bilgiler sunar. Öz Yinelemeli Değerkavramı, piyasa momentumu ve trend gücünün, fiyat hareketi analizinin birden çok katmanının uygulanmasıyla yinelemeli olarak iyileştirilebileceği fikrine dayanır. Bu yinelemeli yaklaşım, geleneksel fiyat bazlı göstergelerin gözden kaçırabileceği derin köklü yükseliş ve düşüş koşullarını tanımlamaya yardımcı olur.
Yükseliş ve Düşüş Ticaret Bölgeleri
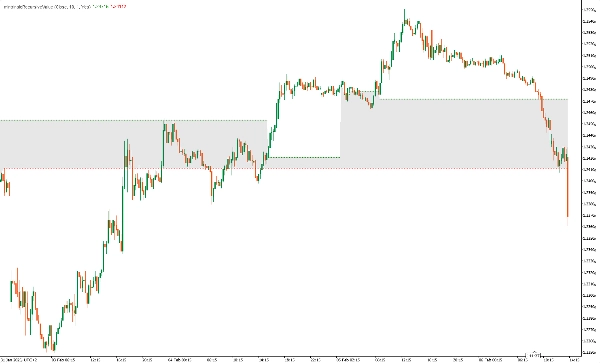
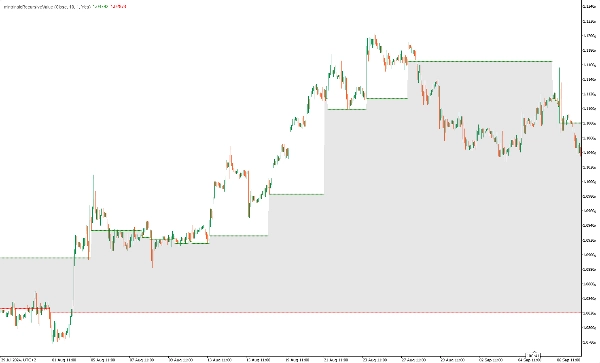
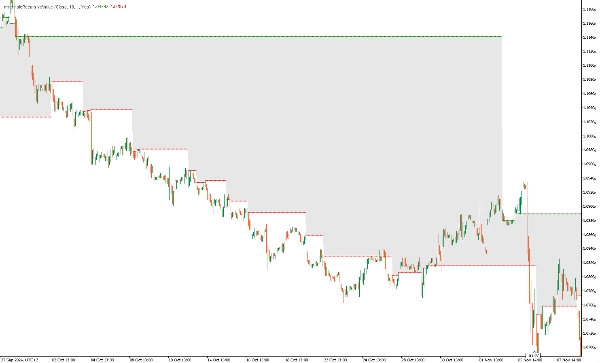
- Yükseliş Ticaret Bölgesi: Öz yinelemeli değer kalıcı yükseliş gücünü doğruladığında bu bölge oluşur. Tüm yinelemeli göreceli güç hesaplamaları denge seviyesinin üzerinde sürekli değerler gösterdiğinde ortaya çıkar ve güçlü yukarı yönlü momentumu işaret eder. Yükseliş ticaret bölgesi, yatırımcıların potansiyel uzun pozisyon giriş noktalarını ve fiyatın yükselmeye devam edebileceği dinamik destek alanlarını belirlemesine yardımcı olur.
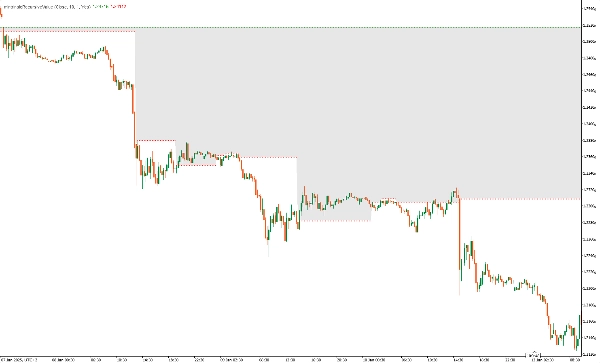
- Düşüş Ticaret Bölgesi: Öz yinelemeli değer sürekli düşüş gücünü tanımladığında bu bölge oluşur. Tüm yinelemeli göreceli güç değerleri denge seviyesinin altındaysa, devam eden bir düşüş trendini işaret eder ve yatırımcılara kısa pozisyon giriş fırsatları sunar ve fiyatın düşmeye devam edebileceği dinamik direnç seviyelerini tanımlar.
Gösterge Çıktıları
- outIntrinsicRecursiveLong : Yükseliş gücü tespit edildiğinde içsel uzun seviyeyi gösterir.
- outIntrinsicRecursiveShort: Düşüş gücü tespit edildiğinde içsel kısa seviyeyi gösterir.
Kullanım
- Trend Onayı: Tüm göreceli güç dönemleri uyum sağladığında güçlü yükseliş veya düşüş trendlerini belirlemeye yardımcı olur.
- Dönüş Tespiti: İçsel değer değiştiğinde potansiyel dönüş noktalarını işaret eder.
- Destek ve Direnç Seviyeleri: İçsel değerler dinamik destek ve direnç seviyeleri olarak işlev görür.
Örnek Ticaret Stratejisi
- Uzun Pozisyon Girişi: İçsel uzun seviyesi belirlendiğinde ve fiyat hareketi yükseliş momentumu doğruladığında uzun pozisyona girin, bu fiyatın denge değerinin üzerinde olduğu anlamına gelir (göstergenin yeşil bileşeni).
- Kısa Pozisyon Girişi: İçsel kısa seviyesi belirlendiğinde ve fiyat hareketi düşüş momentumu doğruladığında kısa pozisyona girin, bu fiyatın denge değerinin altında olduğu anlamına gelir (göstergenin kırmızı bileşeni).
- Çıkış Stratejisi: İşlemlerden çıkmak için takip eden stoplar veya içsel seviyelerin kaybolması kullanılır
Notlar
- Gösterge, trend takip stratejileri için tasarlanmıştır ve trend olan piyasalarda en iyi şekilde çalışır.
- Tetikleme ticaret onayı için momentum göstergeleri gibi diğer göstergelerle birleştirilebilir.
Sonuç
Öz Yinelemeli Değer Göstergesi, yinelemeli göreceli güç hesaplamalarını kullanarak trend analizini geliştirmek isteyen yatırımcılar için güçlü bir araçtır. Yüksek olasılıklı trendlere sahip önemli fiyat seviyelerini belirleyerek, bu gösterge piyasa yönü ve potansiyel ticaret fırsatları hakkında değerli bilgiler sağlar.