

Açıklama
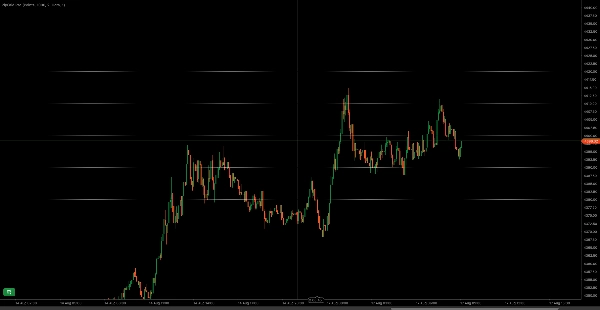
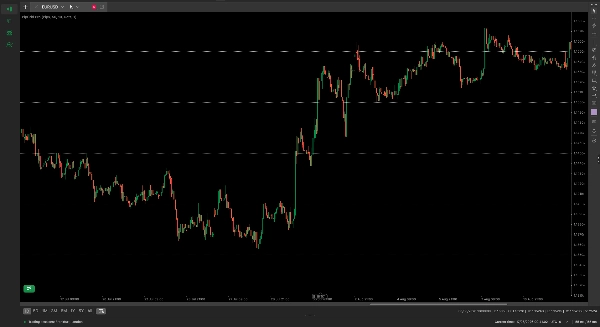
PipGrid Pro tam olarak ticaret stratejinize göre kalibre edilmiş temiz, müdahaleci olmayan yatay fiyat seviyelerini otomatik olarak çizer ve grafiklerinizi kalabalıklaştırmaz.
Kurumsal emir akışı, stop yerleşimleri ve kar alma hedefleri psikolojik tam sayılar ve büyük rakamlar etrafında sürekli kümelenir. Genel betikler enstrümanlar arasında geçiş yaparken bozulurken, genellikle Altın veya Kripto üzerinde binlerce pip uzaklıkta çizgiler çizerken, PipGrid Pro broker tick ve pip özelliklerini yerel olarak okuyarak herhangi bir sembolde matematiksel olarak doğru seviye aralığı sağlar.
Ana Özellikler
- Evrensel Sembol Kalibrasyonu: Pips, Broker Puanları ve Fiyat Birimleri arasında kolayca geçiş yaparak Forex, Metaller (XAUUSD), Endeksler ve Kripto para birimlerinde doğru ölçeklendirme sağlar.
- Güvenli Nesne Ad Alanı: Yalnızca izole edilmiş RNL_ tanımlayıcısı altında çizer. Manuel grafik çizimlerinizi, Fibonacci düzeltmelerinizi veya üçüncü taraf göstergelerinizi asla üzerine yazmaz, değiştirmez veya silmez.
- Dinamik Aralık Takibi: Piyasa fiyatı hareket ettikçe görünür ızgara penceresini otomatik olarak yeniden merkezler ve günceller.
- Tam Görsel Özelleştirme: Çizgi renklerini, stillerini (Düz, Noktalar, Çizgiler, ÇizgilerNoktalar) ve kalınlığını herhangi bir koyu veya açık grafik temasına uyacak şekilde ayarlayın.
- Hafif Çalışma: Performans gecikmesi yok; hesaplamalar yalnızca canlı bar sınır kontrollerinde gerçekleştirilir.
Parametre Ayarları
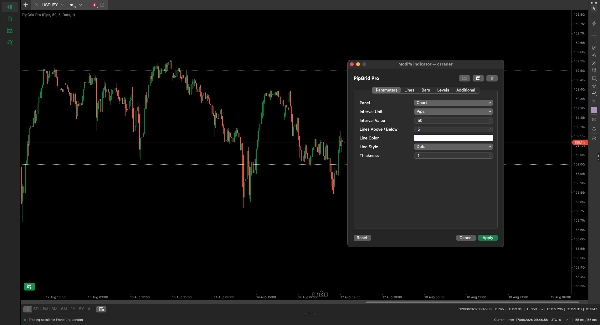
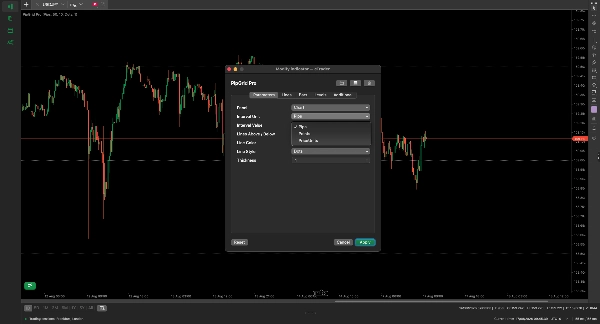
- Aralık Birimi (Varsayılan: Pips) — Tam varlık kalibrasyonu için hesaplama modunuzu Pips, Puanlar veya Fiyat Birimleri arasında seçin.
- Aralık Değeri (Varsayılan: 10.0) — Her yatay ızgara çizgisi arasındaki tam adım mesafesi.
- Üstte / Altta Çizgiler (Varsayılan: 20) — Mevcut piyasa fiyatının üstünde ve altında çizilen toplam ızgara seviyesi sayısı.
- Çizgi Rengi (Varsayılan: Gri) — Çizilen ızgara çizgilerinin görsel rengi.
- Çizgi Stili (Varsayılan: Noktalar) — Çizgiler için görsel desen (Düz, Noktalar, Çizgiler, ÇizgilerNoktalar).
- Kalınlık (Varsayılan: 1) — Yatay çizgilerin çizgi kalınlığı (1 ile 5 arasında değerler).
Önerilen Varlık Konfigürasyonları
- Forex (EURUSD, GBPUSD): Birim olarak Pips ve Aralık olarak 50 veya 100 seçin; kurumsal tam rakamlar için.
- Altın (XAUUSD): Birim olarak Pips ve Aralık olarak 10 veya 50 seçin; temiz $1.00 ve $5.00 fiyat tutamakları için.
- Endeksler (US30, NAS100): Birim olarak Puanlar ve Aralık olarak 100 veya 500 seçin; önemli endeks kilometre taşı seviyeleri için.
- Kripto (BTCUSD, ETHUSD): Birim olarak FiyatBirimi ve Aralık olarak 1000 veya 5000 seçin; büyük psikolojik engeller için.
Özet
AI summary
PipGrid Pro is a technical indicator designed to plot horizontal price levels aligned with psychological round numbers across multiple markets including Forex, Gold (XAUUSD), Indices, and Cryptocurrencies. It automatically calibrates grid spacing by reading broker-specific tick and pip values, ensuring accurate and mathematically consistent level placement on any symbol. The indicator supports toggling between pips, broker points, and price units for precise scaling.
Key functionalities include dynamic range tracking that recenters the grid as price moves, a safe object namespace that prevents interference with manual drawings or other indicators, and full visual customization options for line color, style, and thickness. PipGrid Pro operates efficiently with zero performance lag by executing calculations only on live bar boundaries.
Users can configure parameters such as interval unit and value, number of lines above and below the current price, and visual styles. Recommended settings are provided for different asset classes to highlight institutional order flow clusters and key support/resistance levels. This tool is intended for traders seeking clean, non-intrusive visualization of key price levels that reflect market psychology and institutional activity.
Key functionalities include dynamic range tracking that recenters the grid as price moves, a safe object namespace that prevents interference with manual drawings or other indicators, and full visual customization options for line color, style, and thickness. PipGrid Pro operates efficiently with zero performance lag by executing calculations only on live bar boundaries.
Users can configure parameters such as interval unit and value, number of lines above and below the current price, and visual styles. Recommended settings are provided for different asset classes to highlight institutional order flow clusters and key support/resistance levels. This tool is intended for traders seeking clean, non-intrusive visualization of key price levels that reflect market psychology and institutional activity.
Gösterge profili
Gösterge kategorisi
Destek ve direnç
Çıktı türü
Görselleştirme
Veri gereklilikleri
Yalnızca çubuklar
Tick verisi
Müşteri değerlendirmeleri
0.0
Değerlendirmeler: 0
Müşteri değerlendirmeleri
Bu ürün için henüz bir değerlendirme yok. Ürünü denediniz mi? O zaman ona dair görüşlerini paylaşan ilk kişi olun!
Tartışma
SSS
Key Levels
Support & Resistance
cTrader Store üzerinden erişilebilen işlem botları, göstergeler ve eklentiler gibi ürünler, üçüncü taraf sağlayıcılar tarafından sağlanır ve yalnızca bilgilendirme ve teknik erişim amaçlarıyla sunulur. cTrader Store bir broker değildir ve yatırım tavsiyesi, kişisel öneriler vermez veya gelecekteki performansı garanti etmez.
Bu oluşturanın diğer ürünleri


















Fiyat
Başlangıç 10/12/2024
1
Satışlar