


Açıklama
Ne yapar
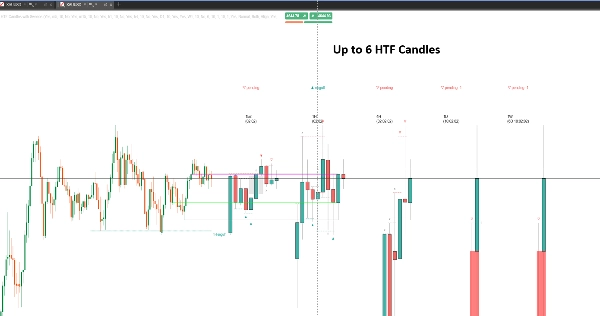
HTF Candles with Sweeps, grafiğinizin yanına gerçek mumlar olarak altı yüksek zaman dilimini çizer — 5d, 15d, 1S, 4S, Günlük, Haftalık veya seçtiğiniz herhangi bir çözünürlük — böylece yüksek zaman dilimi hikayesi, işlem yaptığınız fiyatın yanında olur, bir grafik değiştirme uzağında değil.
Bu mumların üzerinde likidite süpürmelerini tespit eder: oradaki emirleri almak için arkasındaki yüksek veya düşük seviyeyi aşan bir mum. Çoğu araç sadece işareti verir. Bu araç ise ne olduğunu takip eder, çünkü geri alınan bir süpürme ile bir kırılmaya dönüşen süpürme zıt anlamlar taşır.
Yüksek zaman dilimi paneli
Her biri kendi zaman dilimi, mum sayısı ve renklerine sahip altı bağımsız yuva. Her set doğru gövdeler ve fitillerle, bir sonraki kapanışa canlı geri sayım ve üstte ve altta zaman dilimi etiketleriyle çizilir.
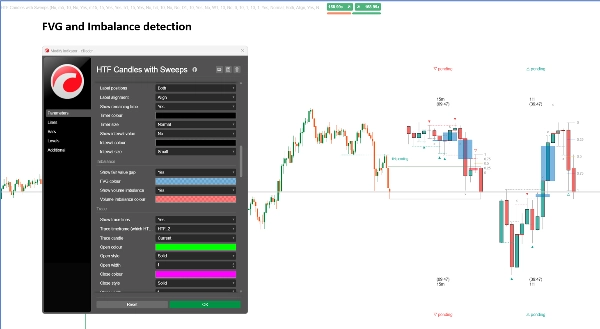
Çizilen mumların arasında panel ayrıca adil değer boşlukları ve hacim dengesizlikleri işaretler — bunlar, yüksek zaman dilimi grafiğinde açmadan okuyacağınız aynı dengesizliklerdir.
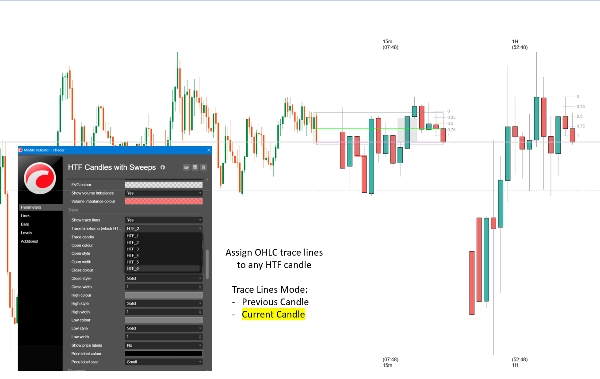
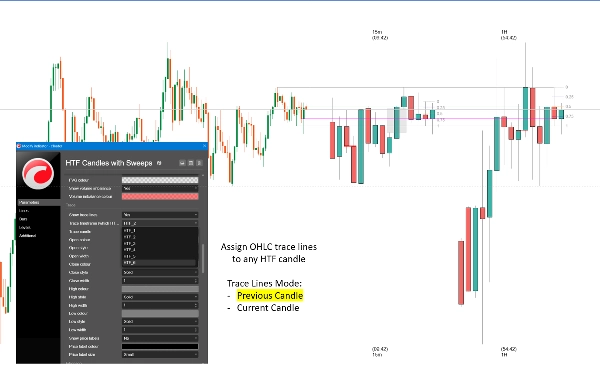
İz çizgileri seçilen bir zaman diliminin açılış, yüksek, düşük ve kapanışını, her birinin basıldığı tam çubukla grafiğinizde geri bağlar, böylece bir seviyenin nereden geldiğini görebilirsiniz. Hala oluşan mumu veya son tamamlananı seçin.
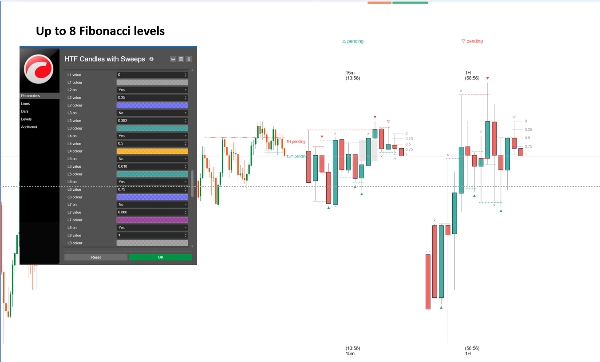
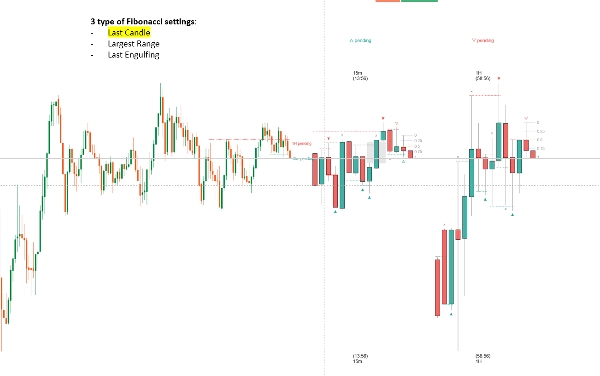
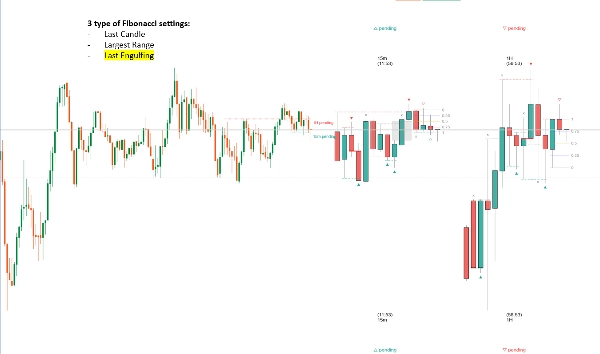
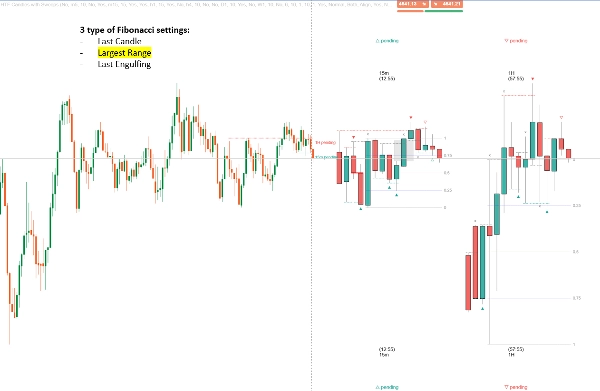
Fibonacci seviyeleri yüksek zaman dilimi mumundan sekiz yapılandırılabilir seviye ve sizin için mumu seçen Akıllı Çapa ile projeksiyon yapar: son tamamlanan çubuk, görünümdeki en geniş yüksek-düşük mum veya en son yutan mum.
Likidite süpürme tespiti
Her tamamlanan yüksek zaman dilimi mumu için motor geriye doğru yürür ve mumun gerçekten aştığı en yüksek yüksek — veya en düşük düşük — seviyeyi bulur, aşamadığı ilk mumda durur. Bu seviye süpürmenin aldığı seviyedir.
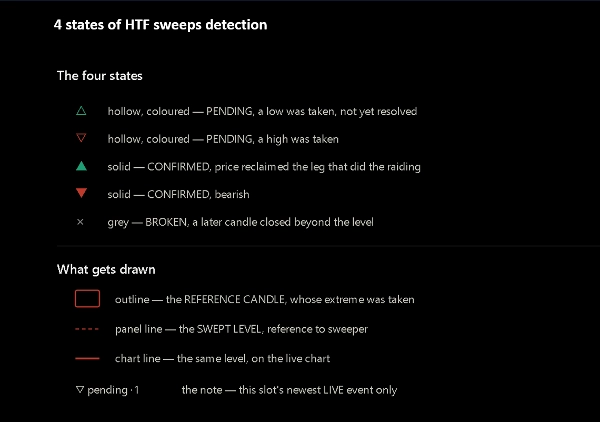
Süpürme daha sonra dört durumda takip edilir:
— Beklemede — seviye alındı, henüz çözülmedi
— CISD tarafından onaylandı — fiyat, ekstremi üreten hareketin açılışının üzerinden kapandı
— Yutma ile onaylandı — sonraki bir mumun gövdesi süpüren mumu yuttu ve ona karşı kapandı
— Kırıldı — sonraki bir mum seviyenin ötesinde kapandı, yani bu bir kırılmaydı, süpürme değil
Her durum kendi işaretçisini taşır, böylece bir şeyi süpüren mum her zaman bunu gösterir ve işaretçi nasıl bittiğini söyler. Hiçbir şey yeniden çizilmez: sadece tamamlanan mumlar değerlendirilir ve her durum değişikliği kapanışta kararlaştırılır.
Zaman dilimleri arası uyum
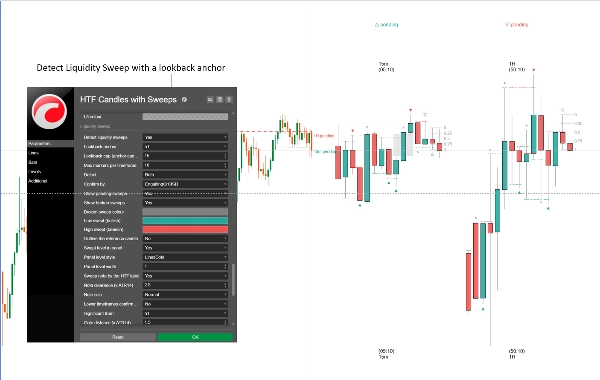
Bir geri bakış penceresi, bir çapa zaman diliminin mumlarıyla ifade edilir ve her yuvanın kendi mum sayısına dönüştürülür, böylece 15d süpürme ve saatlik süpürme aynı piyasa aralığında ölçülür. Birkaç zaman dilimi aynı fikirde olduğunda, gerçekten aynı olayı tanımlıyorlar demektir.
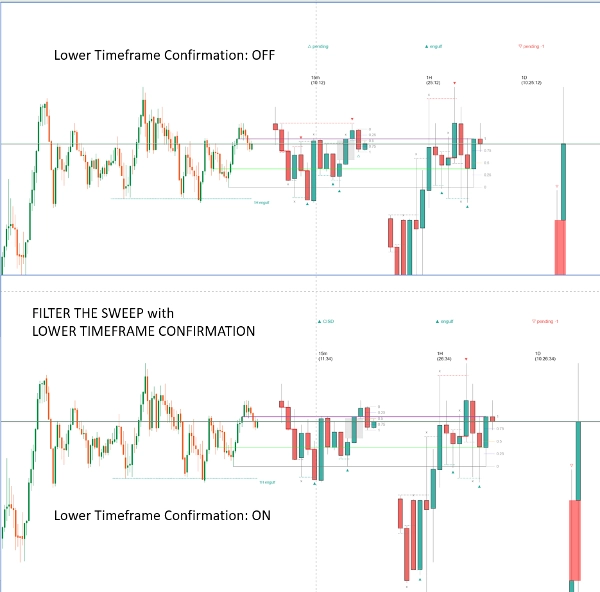
İsteğe bağlı bir kapı bunu daha da ileri götürür: seçtiğiniz bir bölünmenin altındaki zaman dilimleri, üstlerindeki zaman dilimi aynı yönde ve benzer fiyatta canlı bir süpürme olduğunda süpürme bildirir. Daha düşük zaman dilimleri aralık gürültüsünü bildirmeyi bırakır ve daha büyük hareketi onaylamaya başlar.
Grafiğinizde süpürülmüş seviyeler
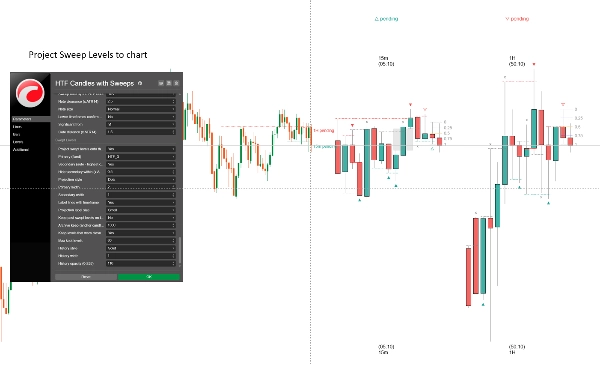
Panel mumları gösterir; grafik fiyatı gösterir. Süpürülmüş bir seviye, referans mumun gerçekten oluştuğu yerden başlayarak ileriye doğru çizilen yatay bir çizgi olarak çizilir — zaman dilimi ve mevcut durumu ile etiketlenir. Birincil çizgi sabitlediğiniz zaman diliminden gelir; ikincil çizgi otomatik olarak şu anda süpürülmüş en yüksek diğer zaman dilimi ile dolar.
İsteğe bağlı bir arşiv, mum panelden çıktıktan sonra geçmiş süpürülmüş seviyeleri grafikte tutar, böylece tespit davranışını oturum boyunca geriye dönük inceleyebilirsiniz.
Tipik kullanım
Saatlik ve 4 saatlik mumlar yanınızda dururken 5d veya 15d grafikten işlem yapın. Yüksek zaman dilimi bir seviyeyi süpürüp onayladığında, çalışabileceğiniz bir yön ve fiyatınız olur. Daha düşük zaman dilimi de aynı fikirdeyse, uyumunuz olur. Bir seviye kırılırsa, işaretçi bunu da söyler ve gelmeyen bir dönüşü beklemeyi bırakırsınız.
Likidite süpürme ve akıllı para tarzı işlemler, başarısız kırılma çalışmaları ve önceki yüksekler ve düşükler etrafında kurulu herhangi bir yaklaşım için uygundur. Forex, endeksler, metaller ve kripto genelinde faydalıdır.
Ayarlar
— Altı zaman dilimi yuvası, her biri çözünürlük, mum sayısı, fibonacci açma/kapama ve tam stil ile
— Panel düzeni: fiyattan boşluk, mum genişliği, mumlar arası ve zaman dilimleri arası boşluk
— Etiketler: zaman dilimi adı üstte ve altta, geri sayım sayacı, aralık değerleri, boyutlar ve renkler
— Dengesizlik: adil değer boşlukları ve hacim dengesizlikleri, renkler ayarlanabilir
— İz çizgileri: hangi yuva, mevcut veya önceki mum, çizgi başına renk, stil, genişlik ve fiyat etiketleri
— Fibonacci: bireysel değerler, renkler ve açma/kapama ile sekiz seviye, artı üç Akıllı Çapa modu
— Süpürme tespiti: geri bakış çapasının sınırı, yön, onay yolu, zaman dilimi başına işaretçi limiti
— Beklemede, onaylandı ve kırıldı durumları için işaretçi görünümü
— Uyum kapısı: bölünmüş zaman dilimi ve mesafe toleransı
— Grafik projeksiyonu: birincil yuva, otomatik ikincil, stiller ve etiketler
— Arşiv: çapa mumlarında tutma, maksimum saklanan, stil
Kimler için
Zaten yüksek zaman dilimi yüksek ve düşüklerinden çalışan ve bunları grafik değiştirmeden görmek isteyen günlük ve swing traderlar için. Likidite süpürmesinin ne olduğunu ve neden geri almanın önemli olduğunu bildiğinizi varsayar. Süpürmeler zaten grafik okuma şeklinizin parçası değilse, bunu size öğretmez.
Ne yapmaz
Bunu şimdi netleştirmek ikimiz için de sonra zaman kazandırır:
— Alım veya satım sinyali vermez, giriş, stop veya hedef fiyatları sunmaz
— Emir vermez ve hesabınıza dokunamaz — gösterge hiçbir erişim hakkı olmadan çalışır
— Uyarı veya bildirim yoktur
— Hiçbir şey tahmin etmez. Her işaretçi zaten kapanmış mumları tanımlar
— Yeniden çizmez. Sadece tamamlanan mumlar değerlendirilir, bu yüzden bir işaretçi sonradan değişmez
— Bir strateji değildir. Onaylanmış bir süpürme, fiyatın ne yaptığını anlatır, sizin ne yapmanız gerektiğini değil
Bilmeniz gerekenler
Tespit, her yuvanın gerçekten çizdiği mumları okur, böylece bir süpürmenin işaretleyecek bir mumu her zaman ekranda olur.
Bir yuvanın mum sayısını artırmak, ne kadar geriye bakabileceğini genişletir.
Yüksek zaman dilimi mumları brokerınızın sunucu zamanında başlar. Aynı enstrüman için iki broker saati veya günü farklı noktalarda kesebilir, bu da aynı sembolün iki platformda meşru olarak farklı okunabileceği anlamına gelir. Bu verinin bir özelliğidir, göstergenin hatası değildir.
En son kapanan mumdaki bir süpürme sadece beklemede olabilir — onay için sonraki bir mumun kapanması gerekir. Günlük yuva için bu bir gün beklemek anlamına gelir.
Ticaret risk içerir. Geçmiş performans gelecekteki sonuçları garanti etmez.
Özet
The indicator detects liquidity sweeps—candles that trade through previous highs or lows to capture resting orders—and tracks their resolution through four states: pending, confirmed by close inside the sweep’s range, confirmed by engulfing candle, or broken (breakout). These states are visually marked and only finalized on completed candles, ensuring no repainting.
Additional features include marking fair value gaps and volume imbalances between candles, trace lines linking higher timeframe candle levels to your chart, and configurable Fibonacci levels projected from selected higher timeframe candles with smart anchoring options.
Cross-timeframe confluence is supported by aligning sweep detection across multiple timeframes, with an optional gate to filter lower timeframe sweeps that confirm higher timeframe moves. Swept levels are drawn as horizontal lines on your chart with labels indicating timeframe and state, with an optional archive to retain past levels.
Designed for intraday and swing traders familiar with liquidity sweeps and higher timeframe analysis, it supports markets including forex, indices, metals, and crypto. The indicator does not provide trade signals, alerts, or order execution and operates solely as a visual analysis tool based on completed price data.
Tartışma
Müşteri değerlendirmeleri
SSS
Bu oluşturanın diğer ürünleri













!["High-Low Divergence [Iridio Capital]" logosu](https://cdn.ctrader.com/image/webp/10a9e91b-243a-43f6-bbfe-7376bad5a214_61554)






Fiyat