present
가입하고 첫 구매 시 $50 할인을 받으세요
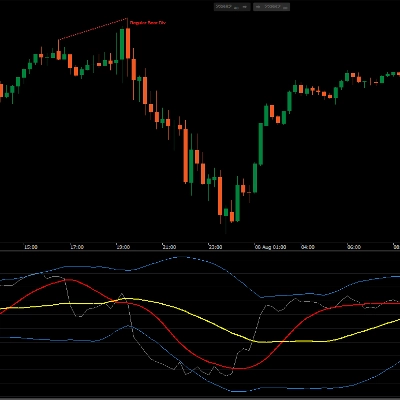
Trading product for Range Pressure Map 지표 EMA Volume, image 1
Range Pressure Map
지표
버전 1.0, Sep 2026
Windows, Mac
5.0
리뷰: 2
Trading product for Range Pressure Map 지표 EMA Volume, image 2
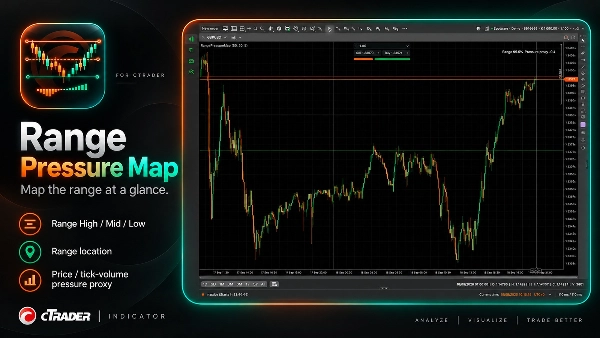
Trading product for Range Pressure Map 지표 EMA Volume, image 3
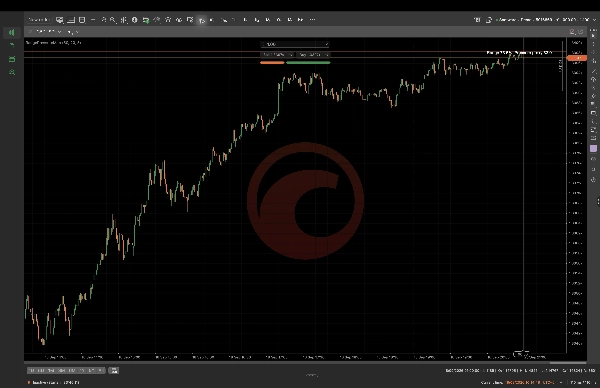
Trading product for Range Pressure Map 지표 EMA Volume, image 4
Trading product for Range Pressure Map 지표 EMA Volume, image 5
가입일 16/09/2026

설명

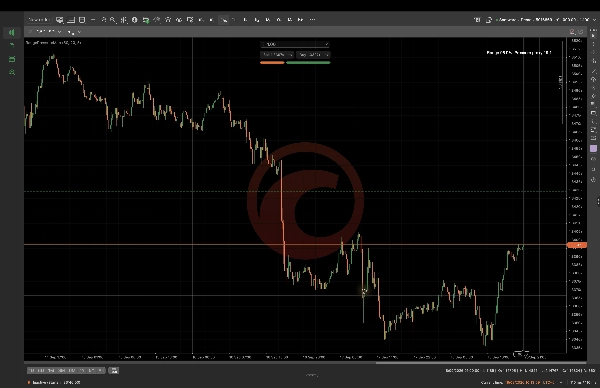
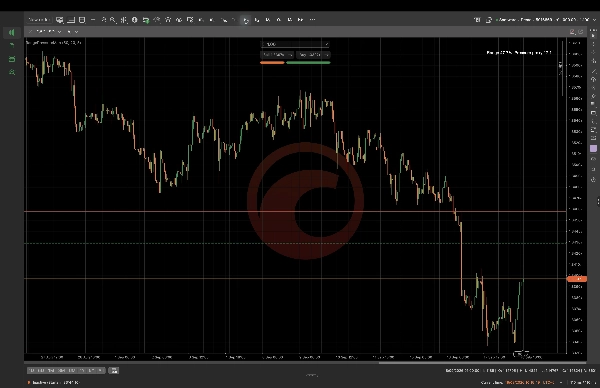
Range Pressure Map는 조회 범위를 계산하고 현재 가격 위치 및 결정론적 틱-볼륨 압력 프록시와 함께 Range High, Range Mid 및 Range Low를 표시합니다. 검토 중인 차트 컨텍스트에 맞게 범위 조회, 압력 조회 및 EMA 길이를 구성하세요. 이는 재량적 차트 분석을 위해 설계되었으며 주문 흐름, 실제 시장 거래량, 매수자 또는 매도자 활동, 예측 또는 자동 거래 실행을 나타내지 않습니다. 값은 선택한 심볼, 시간 프레임, 매개변수 및 사용 가능한 데이터에 따라 달라집니다.

요약

AI 요약
Range Pressure Map is a cTrader indicator that calculates a lookback range and visually displays the Range High, Range Mid, and Range Low levels on your chart. It also shows the current price location within this range alongside a deterministic tick-volume pressure proxy, which serves as an estimate of market pressure based on tick volume data. Users can customize parameters including range lookback period, pressure lookback, and EMA length to align with their specific chart context. This tool is intended for discretionary chart analysis and does not provide order flow data, real market volume, buyer or seller activity, predictive signals, or automated trade execution. Its outputs depend on the selected trading symbol, timeframe, and input parameters. The indicator supports visualization of support and resistance levels combined with volume-based pressure insights to assist traders in analyzing price action within defined ranges.
지표 프로필
지표 카테고리
지지 및 저항
출력 유형
시각화
데이터 요구 사항
막대만

상담

고객 리뷰

5.0
리뷰: 2
5
100 %
4
0 %
3
0 %
2
0 %
1
0 %
고객 리뷰
October 20, 2026
Range Pressure Map provided a clean and consistent range view on EURUSD and XAUUSD across H1 and M1. High, Mid and Low levels were clearly plotted, while the displayed range percentage matched the visible price location well. The pressure proxy added context without cluttering the chart or being presented as true order flow. Score 4,7/5
October 7, 2026
A range high, midpoint and low put the pressure proxy in a clear setting. Lookback and EMA controls make the view adjustable, and the description is upfront about using tick volume rather than real buyer and seller flow. That honesty makes the map easier to interpret.

자주 묻는 질문(FAQ)

EMA
Volume
트레이딩 봇, 지표, 플러그인 등 cTrader Store에서 제공되는 상품은 제3자 개발자에 의해 제공되며, 이는 단순히 정보 및 기술적 접근을 목적으로 제공된 것입니다. cTrader Store는 중개인이 아니며, 투자 조언, 개인별 추천 또는 향후 성과에 대한 어떠한 보장도 제공하지 않습니다.
이 작성자의 상품 더 보기

지표
BOS
MSS
+4
See confirmed BOS, CHOCH and SWEEP structure events on your cTrader chart.
지표
BOS
Add standard-timeframe context candles to a native Renko chart.
지표
Channel
Key Levels
+1
Monitor a selected chart trendline and confirm breaks on candle close.
데스크톱 플러그인
Trade Journal
Trade Statistics
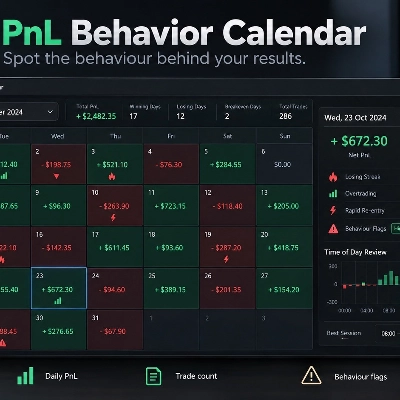
Review daily PnL, trade counts, losing streaks and rapid re-entry from your cTrader history.
데스크톱 플러그인
Chart UI Tools
Keep lines, zones and channels synced across selected same-symbol charts from one desktop plugin.
cBot
Drawdown Guard
Daily Loss Limit
Monitor account-wide loss and stop-loss risk budgets, with optional order cancellation and post-fill closure.
데스크톱 플러그인
Position Sizer
Risk Calculator
Size manual trades from your risk settings and review Market, Limit or Stop orders before execution.
지표
Volume
Key Levels
View tick activity across a selected chart range with Point of Control, Value Area High and Value Area Low.

좋아하실 만한 다른 항목

지표
Volume
Key Levels
View tick activity across a selected chart range with Point of Control, Value Area High and Value Area Low.
지표
Forex
Crypto
+3
ICT Advanced Swings Indicator – Multi-Timeframe Precision
지표
ATR
EMA
+4
The FULL-MARKET-VIEW-DASHBOARD is a professional-grade trading suite for cTrader that eliminates market noise.
지표
SMC
Prop
+5
Order Block PRO — Smart Institutional Zone Detector
지표
Prop
Forex
+5
Traders Panel: Scan 15 pairs across 5 timeframes. Live heatmap, strength rankings and best setups in one panel.
지표
SMC
Forex
+5
Detects Break of Structure (BOS) and Change of Character (CHOCH)
지표
Imbalance
Fair Value Gap
+4
Fair Value Gap scanner with live fill telemetry, 50% CE lines, 4 mitigation rules, and a 3-stage native alert system.
지표
Forex
Identify 34 candlestick patterns, track trends across timeframes, and get instant alerts with this powerful trading tool
지표
ATR
SMC
+20
Session boxes, liquidity sweeps and higher‑timeframe levels for intraday trading
지표
Volume
Order Block
+3
Map market structure, order blocks, liquidity and key zones with an interactive cTrader dashboard.
지표
Doji
Wedge
+5
Angora Pattern Recognition is a cTrader indicator that finds, draws and tracks classic chart patterns automatically.
지표
SMC
Forex
+5
Detect institutional breakout zones with smart volume & channel analysis — by PrimeQuant.
지표
BOS
EMA
+5
Market structure signals graded A to C, each with a drawn trade plan, plus an adaptive trend ribbon and a trend matrix
지표
Forex
Fibonacci
+2
Enhance your trading with customizable alerts and dynamic visual tools for trendlines, Fibonacci levels, and more.
지표
SMC
Prop
+12
SMC Pro Suite: OBs, FVGs, Structure, Liquidity, Killzones & MTF overlay. Every concept in one cTrader indicator.
지표
ATR
RSI
+2
This indicator works best as a trend-confirmation tool—wait for multiple signals!
지표
ATR
SMC
+21
MA Quant Adaptive Price Zone Oscillator identifie dynamiquement les zones de prix optimales pour les entrées et sorties.
지표
RSI
BTCUSD
+5
Traders Dynamic Index (TDI) — Divergence Edition

가격

가입일 16/09/2026