
Açıklama
UTBot Göstergesinin İşleyişi (İtalyanca)
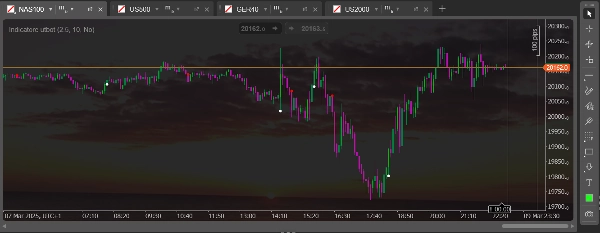
UTBot göstergesi, ATR'ye dayalı dinamik bir takip eden stop çizgisi oluşturan teknik analiz aracıdır. ATR'yi bir hassasiyet faktörü ile çarparak bir stop değeri hesaplar ve böylece volatiliteye uyum sağlayan destek/direnç oluşturur. Fiyat bu çizginin üzerinde kaldığında yükseliş trendlerini, altında kaldığında ise düşüş trendlerini belirler. Fiyat çizgiyi alttan üste doğru geçtiğinde alış sinyalleri, üstten alta geçtiğinde satış sinyalleri üretir. Takip eden stop çizgisi ile EMA kesişimi genellikle onay olarak kullanılır. Yönlü piyasalarda ve açık pozisyonlar için dinamik stopların yönetiminde etkilidir.
UTBot Indicator Functionality (English)
The UTBot indicator is a technical analysis tool that creates a dynamic trailing stop line based on ATR. It calculates a stop value using ATR multiplied by a sensitivity factor, creating support/resistance that adapts to volatility. It identifies uptrends when price stays above this line and downtrends when below. It generates buy signals when price crosses above the line from below and sell signals when crossing below from above. An EMA crossover with the trailing stop line is often used as confirmation. It's effective in directional markets and for managing dynamic stops for open positions.
Özet
Müşteri değerlendirmeleri
5 | 100 % | |
4 | 0 % | |
3 | 0 % | |
2 | 0 % | |
1 | 0 % |


!["[Stellar Strategies] MARSI Signal Plotter" logosu](https://cdn.ctrader.com/image/webp/7b2b8da6-8f8e-4646-8d4a-4710c516c01e_25567)


!["[Hamster-Coder] Bollinger Bands" logosu](https://cdn.ctrader.com/image/webp/21d8e5d6-fb11-4bac-b9ee-cd05c2b76804_30327)