
DynamicVolumeSupplyDemand
Indikator
1.29K muat turun
Versi 1.0, Apr 2025
Windows, Mac
4.2
Ulasan: 5
Penerangan
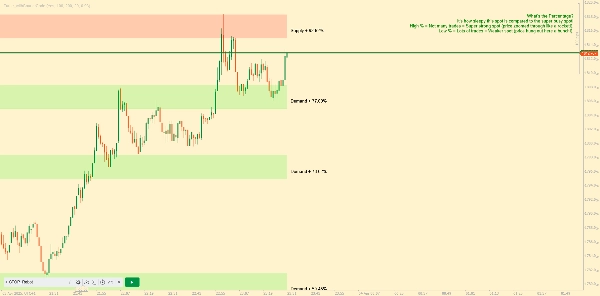
Memperkenalkan Zon Bekalan dan Permintaan Dinamik oleh AlgoAlpha yang dihasilkan semula oleh saya untuk Platform Ctrader. Penunjuk ini direka untuk secara automatik mengenal pasti dan memvisualisasikan zon bekalan dan permintaan dinamik pada carta anda, membantu pedagang mengenal pasti kawasan pembalikan potensi dan menilai sentimen pasaran dengan kejelasan yang dipertingkatkan. Ia menyesuaikan diri dengan keadaan pasaran menggunakan mekanisme lihat ke belakang dinamik, menjadikannya lebih responsif terhadap pergerakan harga terkini. 📈💡
Ciri-ciri Utama
- 📊 Lihat Ke Belakang Dinamik: Secara automatik menyesuaikan tempoh lihat ke belakang berdasarkan titik pivot terkini, memastikan data yang paling relevan dianalisis.
- 🎯 Pengesanan Titik Pivot: Menggunakan tempoh yang ditetapkan pengguna untuk mengesan titik pivot tinggi dan rendah yang signifikan, menandakan titik pembalikan potensi dengan ketepatan.
- 🛠 Parameter Boleh Disesuaikan: Menawarkan pilihan penyesuaian yang meluas termasuk tempoh lihat ke belakang, kepekaan pengesanan pivot, resolusi, dan toleransi zon.
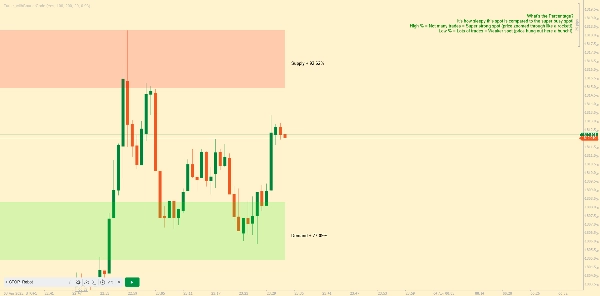
- 🗺 Paparan Visual: Menunjukkan zon bekalan dan permintaan sebagai kotak pada carta, penyorotan latar belakang untuk membezakan antara zon bullish dan bearish.
- 🖍 Zon Berwarna Kod: Zon diwarnakan untuk pengenalan mudah: hijau untuk bullish, merah untuk bearish, dan kelabu untuk tahap neutral.
Ringkasan
Ringkasan AI
DynamicVolumeSupplyDemand is an indicator for the cTrader platform that automatically identifies and visualizes dynamic supply and demand zones on trading charts. It helps traders locate potential reversal areas and evaluate market sentiment by adapting to recent price movements through a dynamic look-back mechanism. Key features include:
- Dynamic Look-Back: Automatically adjusts the look-back period based on the latest pivot points to analyze the most relevant data.
- Pivot Point Detection: Uses a user-defined period to detect significant pivot highs and lows, marking potential reversal points.
- Customizable Parameters: Allows adjustment of look-back period, pivot detection sensitivity, resolution, and zone tolerance.
- Visual Display: Presents supply and demand zones as boxes on the chart with background highlighting to distinguish bullish and bearish zones.
- Color-Coded Zones: Zones are color-coded for clarity—green for bullish, red for bearish, and gray for neutral levels.
This indicator supports enhanced clarity in market analysis by dynamically adapting to changing market conditions and providing clear visual cues for supply and demand levels.
Profil indikator
Ulasan pelanggan
4.2
Ulasan: 5
5 | 40 % | |
4 | 40 % | |
3 | 20 % | |
2 | 0 % | |
1 | 0 % |
Ulasan pelanggan
October 12, 2025
Could you please make a new indicator so too remove the explanation and how the indicator works written on the chart? Very nice indicator otherwise!
August 12, 2025
Pros: Identifies dynamic supply and demand zones based on volume. Flexible settings, strong visual clarity. Cons: No alerts or tooltips. Lacks history of previous zones and user template saving.
May 15, 2025
This indicator finds the supply and demand areas very well but it has a problem. But the explanation and how the indicator works written on the chart is very annoying. I hope the designer of this software will solve this problem. Thank you
Perbincangan
Soalan Lazim
Produk yang tersedia melalui cTrader Store, termasuk bot dagangan, indikator dan plugin, disediakan oleh pembangun pihak ketiga dan diberikan akses untuk tujuan maklumat dan teknikal sahaja. cTrader Store bukan broker dan tidak memberikan nasihat pelaburan, syor peribadi atau sebarang jaminan prestasi masa hadapan.


Harga
Sejak 09/01/2025
11.78K
Pemasangan percuma