![Trading product for [Stellar Strategies] Market Structure Breakout Gösterge Signal Breakout, image 1](https://cdn.ctrader.com/image/webp/bceec265-3247-4b11-915f-6295a29c106d_28465)
![Trading product for [Stellar Strategies] Market Structure Breakout Gösterge Signal Breakout, image 2](https://cdn.ctrader.com/image/webp/01ab79aa-faea-416f-a7e8-dac2f6195047_28466)
![Trading product for [Stellar Strategies] Market Structure Breakout Gösterge Signal Breakout, image 3](https://cdn.ctrader.com/image/webp/3588f2c0-dd5a-4df4-967c-fe2b4de791f8_28467)
![Trading product for [Stellar Strategies] Market Structure Breakout Gösterge Signal Breakout, image 4](https://cdn.ctrader.com/image/webp/c098fda7-69e9-4b38-92b0-1561a798b674_28468)
![Trading product for [Stellar Strategies] Market Structure Breakout Gösterge Signal Breakout, image 5](https://cdn.ctrader.com/image/webp/4a442b80-f948-483a-bd0a-8ce3767e6b2e_28469)
Açıklama
Piyasa Yapısı Kırılma Göstergesi
Genel Bakış
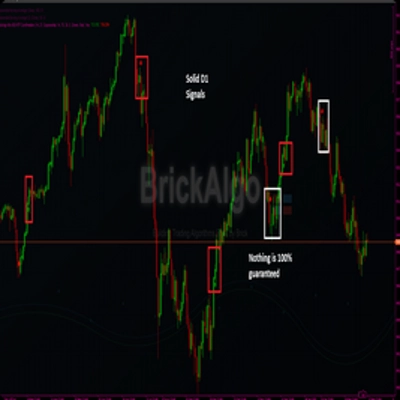
Bu gösterge, cTrader grafiğinizdeki son fiyat aralıklarından kırılmaları tespit ederek potansiyel işlem fırsatlarını belirlemek için tasarlanmıştır. Fiyatın son yüksek seviyenin önemli ölçüde üzerinde (potansiyel yükseliş devamı/geri dönüşü) veya son düşük seviyenin altında (potansiyel düşüş devamı/geri dönüşü) kapanmasını görsel olarak vurgular ve piyasa yapısı kırılma kavramlarından ilham alır.
Nasıl Çalışır
- Aralık Tanımlama: Her çubuk için gösterge, belirtilen önceki çubuk sayısı kadar geriye bakar (
Lookback Periodile tanımlanır). Bu süre içinde ulaşılan mutlak en yüksek yüksek fiyatı ve en düşük düşük fiyatı belirler. - Kırılma Tespiti: Mevcut çubuğun kapanış fiyatının, lookback döneminde bulunan en yüksek yüksekten (yükseliş kırılması) yüksek veya en düşük düşükten daha düşük (düşüş kırılması) olup olmadığını kontrol eder.
- Trend Filtreleme (İsteğe Bağlı): Eğer
Enable Trend Filtertrueolarak ayarlanmışsa, gösterge ayrıca fiyatı Bir Hareketli Ortalama (Trend MA Period&Trend MA Type) ile karşılaştırır. -
- Yükseliş kırılması sinyali, kapanış fiyatı aynı zamanda Hareketli Ortalama'nın üzerindeyse geçerli kabul edilir.
- Düşüş kırılması sinyali, kapanış fiyatı aynı zamanda Hareketli Ortalama'nın altındaysa geçerli kabul edilir. Bu, MA tarafından tanımlanan hakim trende karşı olan kırılmaları filtrelemeye yardımcı olur.
Görsel Öğeler
- Oklar:
-
- Bir Yükseliş Oku (varsayılan LimeGreen), son en yüksek yüksek seviyenin üzerinde kapanan bir çubuğun düşük seviyesinin altında görünür (ve trend filtresi etkinse bunu sağlar).
- Bir Düşüş Oku (varsayılan Kırmızı), son en düşük düşük seviyesinin altında kapanan bir çubuğun yüksek seviyesinin üzerinde görünür (ve trend filtresi etkinse bunu sağlar).
- Okun çubuktan uzaklığı, ATR kullanılarak piyasa volatilitesine göre otomatik olarak ayarlanır (
Arrow ATR Offset Multiplier).
- Yatay Çizgiler:
-
- Bir yükseliş kırılması gerçekleştiğinde, kırılan en yüksek yüksek seviyede bir Kırık Direnç Çizgisi (varsayılan Kırmızı) çizilir.
- Bir düşüş kırılması gerçekleştiğinde, kırılan en düşük düşük seviyede bir Kırık Destek Çizgisi (varsayılan LimeGreen) çizilir.
- Bu çizgiler, yüksek/düşük pivotun gerçekleştiği çubuktan başlar ve kırılma çubuğunun ardından
Line Extension Barskadar ileriye uzanır. Bu, kırılan seviyeyi görselleştirmeye yardımcı olur. - Çizgi stili ve kalınlığı özelleştirilebilir.
- Etiketler (İsteğe Bağlı):
-
- Eğer
Label TypeNoneolarak ayarlanmadıysa, genişletilmiş yatay çizginin sonunda bir metin etiketi görünür. - Bu, gerçek
Priceseviyesi, özelText(örneğin "MSB") veyaBothgösterebilir. - Etiket rengi özelleştirilebilir.
- Eğer
- Geçmiş Limiti: Grafiği temiz tutmak için sadece en son
Max Historical Breakoutssayıda yükseliş ve düşüş sinyali (ok + çizgi + etiket) gösterilir. Bunu 0 yapmak tümünü gösterir.
Nasıl Kullanılır ve Nelere Dikkat Edilmeli
- Giriş Sinyalleri: Kırılma okları, kırılmanın yönünde potansiyel giriş noktalarını işaret edebilir. Yükseliş oku olası uzun pozisyon girişini, düşüş oku ise olası kısa pozisyon girişini gösterir.
- Onaylama: Sinyalleri doğrulamak için kırılmaları diğer analiz türleriyle (ör. hacim analizi, grafik formasyonları, temel analiz) birlikte kullanın. Sadece bu göstergeye güvenmeyin.
- Destek/Direnç: Gösterge tarafından çizilen yatay çizgiler, fiyatın daha önce durduğu seviyeleri temsil eder. Bir kırılmadan sonra bu seviyeler rollerini değiştirebilir:
-
- Kırılan bir direnç seviyesi (kırmızı çizgi) potansiyel gelecekte destek olarak işlev görebilir.
- Kırılan bir destek seviyesi (yeşil çizgi) potansiyel gelecekte direnç olarak işlev görebilir. Fiyatın sonraki çubuklarda bu genişletilmiş çizgilerle nasıl etkileşime girdiğine dikkat edin.
- Trend Bağlamı:
Trend Filteretkinleştirmek, daha geniş piyasa yönüyle uyumlu kırılmalara odaklanmanıza yardımcı olabilir ve güçlü trendlere karşı işlemleri azaltabilir. - Parametre Ayarı:
Lookback Periodile deney yapın. Daha kısa dönemler daha hassas olup daha fazla sinyal üretir (potansiyel olarak daha gürültülü). Daha uzun dönemler daha önemli aralıklardan kırılmaları belirler ancak daha az sinyal üretir. Zaman dilimi ve piyasa özelliklerine göre ayarlayın. Takip etmek istediğiniz trendi tanımlamak içinTrend MA Periodayarını yapın. - Zaman Dilimleri: Gösterge herhangi bir zaman diliminde çalışır. Unutmayın ki
Lookback Period20 ise, bu o zaman diliminden 20 çubuk anlamına gelir.
Uyarılar
- Eğer
Enable Sound Alertstrueise, gösterge en son gerçek zamanlı çubukta yeni bir kırılma sinyali belirdiğinde belirtilenAlert Sound Filedosyasını çalar (geri test veya geçmiş yükleme sırasında uyarı vermez).
Ana Parametreler
Lookback Period: En yüksek yüksek/en düşük düşükü bulmak için geçmiş çubuk sayısı.Enable Trend Filter: Hareketli Ortalama filtresini açar/kapatır.Trend MA Period/Type: Trend filtreleme için Hareketli Ortalama ayarları.Max Historical Breakouts: Gösterilen geçmiş sinyal sayısını sınırlar.Arrow ATR Offset Multiplier: Volatiliteye bağlı olarak okun çubuktan uzaklığını kontrol eder.Line Extension Bars: Yatay çizginin kırılmanın ötesine ne kadar uzandığı.Label Type/Custom Label Text: Çizgiler üzerindeki etiketlerin görüntülenmesini kontrol eder.Enable Sound Alerts/Alert Sound File: Sesli uyarıları yapılandırır.- Renk/Stil Parametreleri: Görsel görünümü özelleştirin.
Feragatname: Ticaret risk içerir. Bu gösterge hesaplamalarına dayalı teknik sinyaller sağlar, ancak kar garantisi vermez veya geleceği tahmin etmez. Her zaman risk yönetimi kullanın ve herhangi bir işlem kararı vermeden önce kendi analizlerinizi yapın.
Özet
Visual cues include lime green bullish arrows below bars breaking above highs and red bearish arrows above bars breaking below lows. These arrows are positioned dynamically based on market volatility using the ATR (Average True Range). The indicator also draws horizontal lines at broken support or resistance levels, extending forward to help visualize these key price levels. Labels can be optionally displayed on these lines, showing price, custom text, or both, with customizable colors.
Users can limit the number of historical breakout signals shown to maintain chart clarity. Sound alerts can be enabled to notify when new breakout signals occur in real time. The indicator works on any timeframe, with sensitivity adjustable via the lookback period and trend filter settings. It is intended to assist in identifying entry points and support/resistance levels but should be used alongside other analysis methods.
Müşteri değerlendirmeleri
5 | 100 % | |
4 | 0 % | |
3 | 0 % | |
2 | 0 % | |
1 | 0 % |
!["[Stellar Strategies] BOS Trend 1.0" logosu](https://cdn.ctrader.com/image/webp/6cdec0f1-0e97-4a82-a8a4-2b67aed54d38_25695)
!["[Stellar Strategies] Market Session Ultimate" logosu](https://cdn.ctrader.com/image/webp/61ffd537-0125-4246-9e72-42eca1791d64_28232)
!["[Stellar Strategies] Wave Trend Pro" logosu](https://cdn.ctrader.com/image/webp/5f226fbb-245a-41cd-9cdd-b018257d5e6d_28617)
!["[Stellar Strategies] Inside Bar with Signals" logosu](https://cdn.ctrader.com/image/webp/1d9e8bfa-3b2c-4440-bb37-5856902008a7_30683)
!["[Stellar Strategies] Linear Regression Candles 1.1" logosu](https://cdn.ctrader.com/image/webp/8b9cff9f-2431-46d2-b0ec-c7f55f4a4a6d_27918)
!["[Stellar Strategies] Smart ADX" logosu](https://cdn.ctrader.com/image/webp/af13b084-b6f6-41db-b7bc-c7e688b57b05_36929)
!["[StellarStrategies] Scheduled Trade Executor" logosu](https://cdn.ctrader.com/image/webp/daefc6af-7eca-453e-878d-1b981be2c401_25646)
!["[Stellar Strategies] VBO" logosu](https://cdn.ctrader.com/image/webp/f034c012-94d4-445a-a01b-febd1cdedaef_36944)
!["[Stellar Strategies] SP500 Gap Closure cBot 1.0" logosu](https://cdn.ctrader.com/image/webp/92c23fdc-4ad1-4e61-bdb5-c77f6ec8c539_27686)
!["[Stellar Strategies] Candlestick Patterns Dashboard" logosu](https://cdn.ctrader.com/image/webp/ae8691a5-4884-4553-9bcc-64e16ac82a30_38344)
!["[Stellar Strategies] QQE" logosu](https://cdn.ctrader.com/image/webp/e702104a-874c-4b39-97dd-fb34518d1015_27712)
!["[Stellar Strategies] Visual Trend Momentum" logosu](https://cdn.ctrader.com/image/webp/48aee0a5-f10e-4bc8-9671-78e156fcc5df_27548)