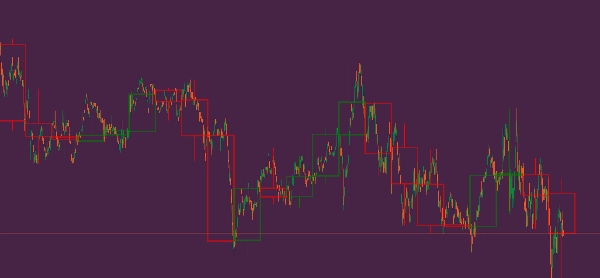
HTFOverlayPlus
"HTFOverlayPlus" logosu
03/09/2025
35
Desktop
Since 10/02/2025
Free installs
479

Este indicador sobrepõe candles de um time frame superior sobre o gráfico do time frame atual. Ele permite visualizar até 50 candles de um time frame maior e ajusta a cor das velas de acordo com a direção do preço (alta ou baixa). O indicador oferece a possibilidade de personalizar a espessura das bordas do corpo das velas e as cores para velas de alta e baixa. Ele é útil para traders que desejam visualizar a ação do preço em time frames superiores enquanto operam em time frames menores, permitindo uma análise mais precisa das tendências. (Obs: funciona com corpo invisível apenas no time frame e o resto apenas pinta.)


This indicator overlays candles from a higher time frame onto the current chart time frame. It allows you to display up to 50 candles from a larger time frame and adjusts the candle color based on price direction (bullish or bearish). The indicator provides the option to customize the body thickness and the colors for bullish and bearish candles. It is useful for traders who want to visualize higher time frame price action while trading on smaller time frames, enabling more accurate trend analysis. (Note: only works with invisible body in the time frame and the rest just paints.)


Este indicador superpone velas de un marco temporal superior en el gráfico del marco temporal actual. Permite mostrar hasta 50 velas de un marco temporal mayor y ajusta el color de las velas según la dirección del precio (alcista o bajista). El indicador ofrece la posibilidad de personalizar el grosor de los bordes del cuerpo de las velas y los colores para las velas alcistas y bajistas. Es útil para los traders que desean visualizar la acción del precio en marcos temporales superiores mientras operan en marcos temporales más pequeños, lo que permite un análisis más preciso de las tendencias. (Nota: solo funciona con cuerpo invisible en el marco temporal y el resto solo pinta.)

Bu oluşturanın diğer ürünleri
VWAP Tabajara
VWAP Tabajara
Tabajara corrigido[fix]
corrigido todos os bugs e cores invertidas tabajara antigo deleetado
Şunları da beğenebilirsiniz
Pips V4Final
Displays pips from daily open with high/low. Clean, customizable, perfect for quick daily price context.
LT_Ind_Candles
Most used candle patterns. (1 candle, 2 candles and 3 candles patterns) and Marubozu. Bonus Fibo Risk control.
[Stellar Strategies] Market Session Ultimate
Ultimate Session Tool: Boxes, OR, KZs, PD Levels, Overlaps, Custom Lines & Names, Info Panel! Highly customizable 📉📈
Gösterge
NAS100
NZDUSD
XAUUSD
+13
RT MACD
Customize the MACD! Choose colors, get real-time tick updates, and see crossover points for enhanced trading precision.
E7 Harmonic Structures Basic
E7 Harmonic Structures Basic.
Gösterge
RSI
Breakout
Supertrend
Adaptive Trend Channel
📊 Visualize market trends more clearly and dynamically
Gösterge
Indices
XAUUSD
Commodities
+8
ATR on Chart
Plots the ATR on the chart for easy visualization.
IR Candle Open
IR Candle Open plots customizable opening price lines for daily, weekly, and monthly candles
Gösterge
RSI
MACD
Multi-Timeframe Market Levels
Unlock market insights with our Multi-Timeframe Market Levels indicator, enhancing your trading strategies effortlessly
SmartLiquidityZonesPRO
Smart Liquidity Zones PRO auto-detects liquidity grabs, wicks, traps & manipulations — trade like the smart money.
IVB 2.0
IVB 2.0 is an indicator that works on the strategy of imbalance of the maximum volatility box of indices
Gösterge
RSI
XAUUSD
Breakout
+4
ZScore Reversion
Z-Score: Measures price deviations from its mean. Spots overbought/sold (±2-3 SD) & reversals. Key for stats trading
Gösterge
Indices
Prop
Breakout
+3
RVI
A precision-crafted indicator that compares current volume to its historical average for the same time of day.
Indicatore livelli numeri tondi_fabio23.traders
Indicatore dei livelli numeri tondi sul grafico , regolabile.Indicator of levels round numbers on the graph, adjustable
Gösterge
Stocks
Forex
Crypto
PinBarCandlestickPattern
PinBarCandlestickPattern Indicator
Gösterge
RSI
Breakout
Supertrend
+3
Fibonacci Linear Regression Multi-timeframe
Combining Fibonacci levels and regression to analyze multidimensional market trends across multiple timeframes¡
Gösterge
XAUUSD
Breakout
Forex
+4
Market Bias Gauge
Measure Market Strength at a Glance – Instantly