
Açıklama
🚀 10.000+ tüccar zaten en iyi göstergelerimizi kullanıyor🏆
Profesyonellerin neden bizi seçtiğini keşfedin – en güçlü araçlar cTrader'da (göstergeler, algoritmalar ve cBotlar) sizi bekliyor.
👉 Tüm en iyi sistemlerimizi buradan edinin:
_______________________________________________
_______________________________________________
📌 Piyasa Yapısı Göstergeleri
· ✅ AdvancedMarket Structure: Bos, Choch, SwinLevels, Order Blocks, Market Structure& Likidite Bulucu
· 🔄 Dinamik Piyasa Yapısı Dönüş Noktalarının Analizi
· 🧱 Order Block
· ⚖️ Piyasa Dengesizliği
· ⛓️ BOS & CHOCH
· 🧠 ICT Güç 3
______________________________________________________________-
Mağaza cBotları : 🧠 Altın & BTC KırılmaOturum Pivotları 🧠
_______________________________________________
🔚 Akıllı Çıkış Sistemleri
· 📍 Takip Eden Akıllı Algoritma
_______________________________________________
📐 ZigZag Göstergeleri
· 🔍 ZigZag Fiyat Likidite Projeksiyonu
· ➖ ZigZag
· 🎯 Zig-Zag Uç Nokta Takipçisi
_______________________________________________
🧱 Destek & Direnç Göstergeleri
· 🟩 SmartTrend Destek & Direnç Çizgileri
· 🧱 Tüm Destek ve Direnç Seviyeleri
_______________________________________________
📊 Trend & Kanal Göstergeleri
· 📊 Süpertrend
· 🧠 Uyarlanabilir Trend Kanalı
· 🔁 Reaktif Hareketli Ortalama
_______________________________________________
💧 Hacim & Likidite Araçları
· 🔍 Momentum Adil Değer Boşluğu
· 🕒 Adil Değer Boşluğu Oturumları
_______________________________________________
⚡ Momentum & RSI Göstergeleri
· 🔎 Çok Katmanlı Mum Yönelim Takipçisi
_______________________________________________
🔮 Tahmin & Projeksiyon Araçları
· 📐 Linreg & ATR'ye Dayalı Tahmin
· 📏 Fibonacci Doğrusal Regresyon Çoklu Zaman Dilimi
· 📈 Hacim Destekli Piyasa Akışı Projeksiyonu
_________________________________________________________________________________
_________________________________________________________________________________
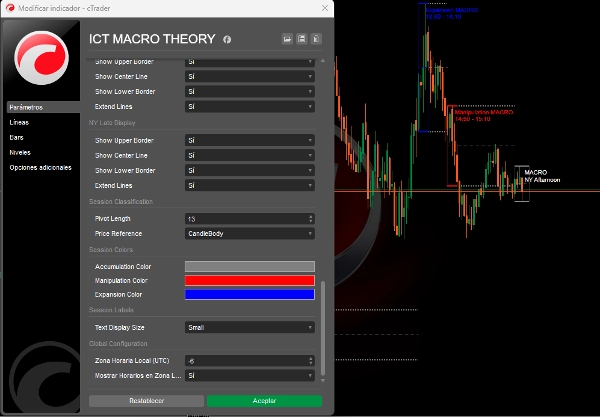
🌐 ICT MAKRO TEORİSİ
⚠️ ÖNEMLİ NOT: Bu gösterge yalnızca 5 dakikadan kısa zaman dilimlerinde çalışır.
ICT Makro Dönemlerinin Açıklaması
ICT makro dönemleri, algoritmanın likidite aradığı veya fiyatı adil değer boşlukları için ayarladığı kısa aralıklardır. Bu ICT makrolarının temeli ICT'nin zaman ve fiyat teorisine dayanır.
Bir makro, "fiyat teslimatında bir olay yaratan kısa bir talimat dizisi" olarak ICT tarafından tanımlanır.
ICT makroları tam ticaret stratejileri değildir, ancak işlemlerinizde uyum sağlayabilir ve karı maksimize edebilir. Londra, New York, öğle ve öğleden sonra oturumlarında gerçekleşirler.
🔮 ICT Makro Zaman Teorisinin Gelişmiş Uygulaması:
ICT Kavramlarına Doğrudan Bağlantı:
Kod, teoride tanımlanan 3 tür ICT makrosunu tam olarak uygular ve sınıflandırma mantığını şunlara dayandırır:
- Piyasa Yapısı Analizi:
-
- Makro Oturumların Tespiti
- Tam ICT zamanlarını kaydeder (Londra 02:33, NY 09:50, vb.).
- Her makro oturum öncesi ve sırasında yapısal değişiklikleri algılar.
- Otomatik olarak sınıflandırır:
-
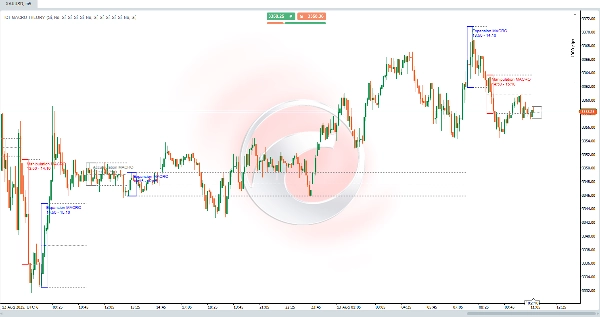
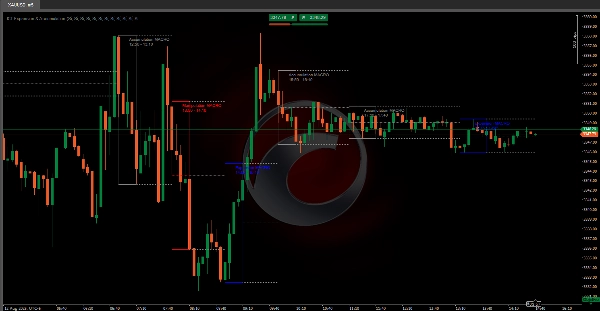
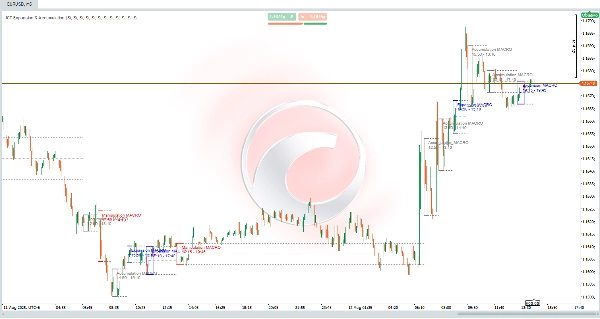
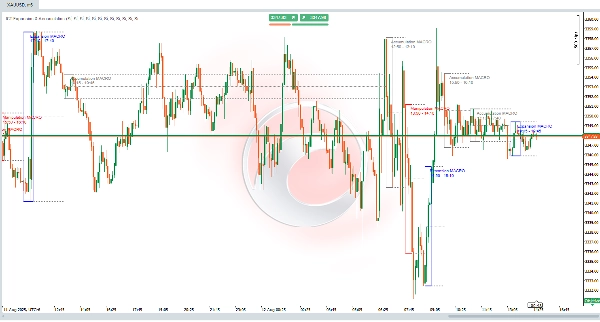
- 🟥 Manipülasyon: Fiyat her iki tarafta (alım/satım) likidite süpürdüğünde.
- 🟦 Genişleme: Yönlü hareketler, bir taraftaki likiditeyi alır (trend ile uyumlu).
- 🟩 Birikim: Fiyatın likiditeyi "biriktirdiği" sıkı aralık.
- Genişletilmiş Ana Seviyeler:
-
- Her makro oturumun yüksek/düşüklerini çizer.
- Ortalama fiyatı (orta nokta) hesaplar ve bir sonraki oturuma uzatır.
- Bu seviyeler dinamik destek/direnç olarak işlev görür (ICT'de çok önemli!).
- Gerçek Zamanlı Likidite Tespiti:
-
- Tam pivotları tanımlamak için 1 dakikalık verileri kullanır (daha düşük zaman dilimlerinde görüldüğü gibi).
Yaklaşan İyileştirmeler & Güncellemeler:
- Likidite Süpürme Tespiti: Önceki likidite süpürmelerini (önceki gün/hafta yüksek/düşükleri) tanımlayacak.
- Adil Değer Boşlukları (FVG): Adil değer boşluklarını tespit edecek ve görselleştirecek.
📊 Pratik ICT Örneği
NY Açılış Senaryosu (09:50-10:10):
- Oturum Öncesi: Fiyat alım tarafı likiditesini süpürür (yerel dip).
- Oturum Sırasında:
-
- 🟥 olarak sınıflandırılır MANİPÜLASYON.
- Fiyat ayı yapısına kayar.
- Oturum Sonrası:
-
- Uzatılmış çizgiler oturum yükseklerinde direnç işaret eder.
- RR 1:3 olan bölgede işlem reddi.
✅ ICT İlkesine Sadık:
"Makrolar tam stratejiler değildir ancak algoritmaların likidite arayacağı yerleri belirleyerek uyum sağlar."
Özet
The indicator analyzes market structure and detects key macro sessions—London, New York, midday, and afternoon—recording exact ICT times. It classifies price behavior into three types of macros: Manipulation (price sweeps liquidity on both sides), Expansion (directional movement aligned with trend), and Accumulation (tight range where price accumulates liquidity). It also draws and extends session highs, lows, and average price levels to act as dynamic support and resistance.
Using 1-minute data, ICT MACRO THEORY detects precise pivots for real-time liquidity identification. While not a complete trading strategy, it adds confluence to trades by highlighting where algorithms seek liquidity. Planned updates include detection of liquidity sweeps and visualization of fair value gaps.
This tool is intended for traders seeking to incorporate ICT macro time concepts into their analysis for enhanced market structure insight and liquidity detection on very short timeframes.


