Açıklama
Pinescriptlabs Store göstergeleri: 🤖Pinescriptlabs Store cBots : (cBot) Gold & BTC BreakoutSession Pivots(yeni)
SmartTrend Destek &
Direnç
Çizgileri
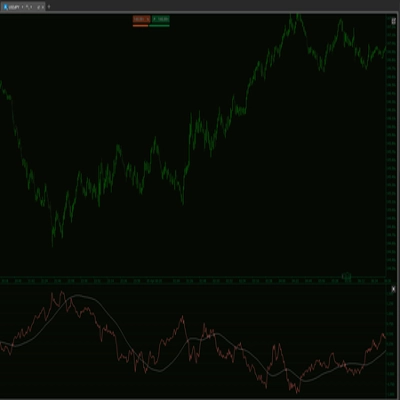
Dinamik
Piyasa Yapısı
Analizi
Dönüş
Noktaları
Puanları
Fibonacci
Doğrusal
Regresyon
Çok Zamanlı
Çok Seviyeli
Mum Yönü
Takipçisi
Otomatik
Destek ve
Direnç
Trend
Çizgileri
Tüm
Destek ve
Direnç
Düzeyleri
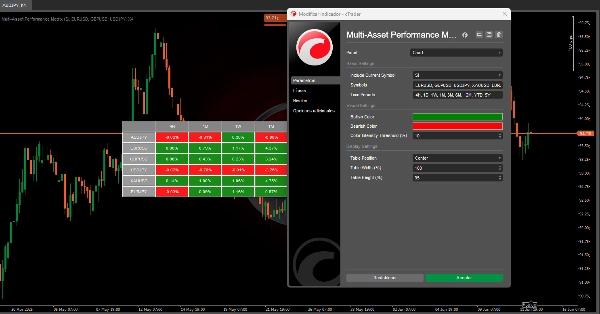
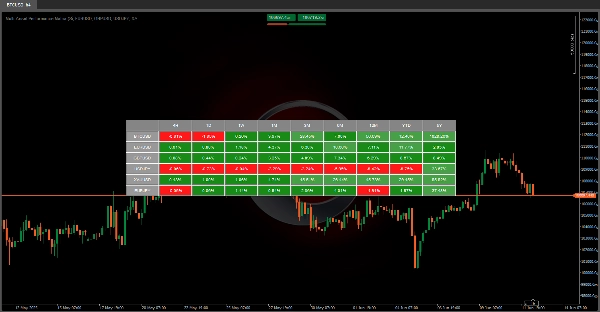
🚀 ÇOKLU VARLIK PERFORMANS MATRİSİ 🚀
Bu algoritma güçlü bir görsel araçtır 📊 farklı zaman dilimlerinde birden fazla finansal aracın yüzdelik performansını göstermek için tasarlanmıştır.
Geçmiş verileri etkili ve sezgisel bir görselleştirmeye dönüştürerek kullanıcıların çeşitli finansal varlıkların davranışlarını hızlıca değerlendirmesine olanak tanır.
❓ Bu Araç Ne Yapar?
1️⃣ 📈 Varlıkları Karşılaştırır: Farklı finansal araçların (örneğin BTCUSD, EURUSD, XAUUSD vb.) fiyatlarının zaman içindeki değişimini gösterir.
- Zaman dilimleri: G (Günlük) | 1H (Haftalık) | 1A (Aylık) | 3A (Çeyreklik) | 6A (Yarı Yıllık) | 12A (Yıllık) | YTD (Yılbaşından Bugüne) | 5Y (Son 5 Yıl)
2️⃣ 🎨 Trendleri Vurgular: Hangi varlıkların her dönemde yükseldiğini veya düştüğünü anında belirlemek için renk kodlaması (🟢, 🔴 ) kullanır.
3️⃣ ⏱️ Otomatik Güncellemeler: En son piyasa bilgilerini yansıtmak için verileri her dakika yeniiler.
💡 Neden Bu Faydalı?
✔ 📊 Karşılaştırmalı Analiz: Birden fazla varlığın yan yana karşılaştırılmasını sağlar—portföy yönetimi için ideal veya zaman dilimlerine göre en iyi performans gösteren varlıkları seçmek için.
✔ 🛡️ Kontrol: Bir varlığın farklı dönemlerdeki tutarlılığını (veya oynaklığını) değerlendirerek ilgili riskleri analiz etmeye yardımcı olur.
✨ Anahtar
✅ ⏳ Zaman Kazandırır: Bu verileri manuel olarak toplamak ve hesaplamak saatler alır—bu araç bunu anında yapar!
✅ 👀 Görsel Olarak Net: Renk kodlu sistem, teknik olmayan kullanıcılar için bile analiz yapmayı kolaylaştırır.
✅ 🔄 Uyarlanabilir: Özel sembolleri destekler, böylece sizin için önemli varlıkları takip edebilirsiniz.
Özet
Müşteri değerlendirmeleri
5 | 100 % | |
4 | 0 % | |
3 | 0 % | |
2 | 0 % | |
1 | 0 % |