
Deskripsi
🚀 Lebih dari 10.000 trader sudah menggunakan indikator TOP kami 🏆
Temukan mengapa para profesional memilih kami – alat paling kuat di cTrader (indikator, algoritma, dan cBots) menunggu Anda.
👉 Dapatkan semua sistem TOP kami di sini:
_______________________________________________
📌 Indikator Struktur Pasar
· ✅ AdvancedMarket Structure: Bos, Choch, SwinLevels, Order Blocks, Market Structure& Liquidity Finder
· 🔄 Dynamic Market StructureAnalysis of Turning Points
· 🧱 Order Block
· ⚖️ Market Imbalance
· ⛓️ BOS & CHOCH
· 🧠 ICT Power of 3
_______________________________________________
🔚 Sistem Keluar Pintar
_______________________________________________
📐 Indikator ZigZag
· 🔍 Proyeksi Likuiditas Harga ZigZag
· ➖ ZigZag
· 🎯 Pelacak Ekstremitas Zig-Zag
_______________________________________________
🧱 Indikator Support & Resistance
· 🟩 Garis Support & Resistance SmartTrend
· 🧱 Semua Level Support dan Resistance
_______________________________________________
📊 Indikator Tren & Saluran
· 📊 Supertrend
_______________________________________________
💧 Alat Volume & Likuiditas
· 🔍 Celah Nilai Wajar Momentum
_______________________________________________
⚡ Indikator Momentum & RSI
· 📈 Pemicu Tren RSI
· 🔎 Bias Lilin Multi-Level
Pelacak
_______________________________________________
🔮 Alat Prediksi & Proyeksi
· 📐 Prediksi Berdasarkan Linreg& ATR
· 📏 Regresi Linear FibonacciMulti-timeframe
· 📈 Proyektor Aliran Pasar Berbasis Volume
________________________________________________________________________________________________________
________________________________________________________________________________________________________
Kurva Bézier Pola McDonalds 🍟
Untuk apa ini? 🤔
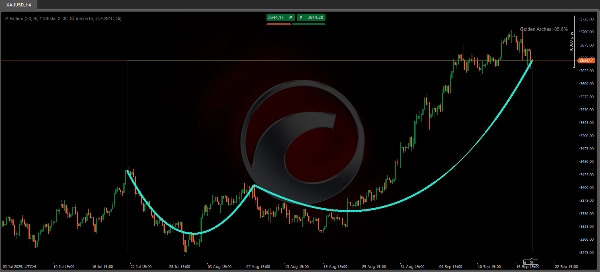
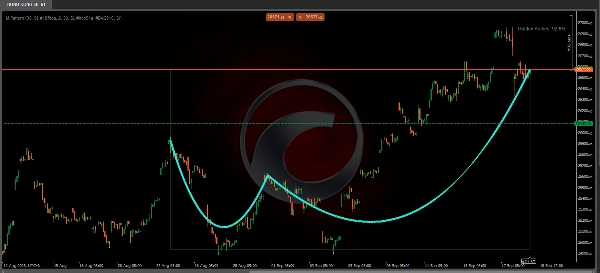
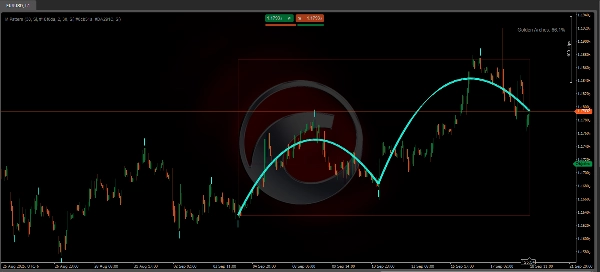
Indikator "Kurva Bézier Pola McDonalds" dirancang untuk mengidentifikasi dan memvisualisasikan pola pembalikan harga menggunakan kurva Bézier. Tujuan utamanya adalah mendeteksi struktur pasar yang menyerupai busur (mirip dengan "M" atau "W") pada grafik, yang dapat menunjukkan potensi perubahan tren 🎯. Selain itu, termasuk sistem penilaian untuk mengevaluasi kualitas pola yang terdeteksi.
Bagaimana cara kerjanya? ⚙️
- Deteksi Pivot:
Indikator menganalisis periode mundur (didefinisikan oleh "Periode Mundur") untuk mengidentifikasi puncak dan lembah lokal (pivot). Ini ditandai dengan lingkaran pada grafik: ⚪ - Kurva Bézier:
Setelah setidaknya 5 pivot terdeteksi, indikator menggambar dua busur menggunakan kurva Bézier yang menghubungkan titik-titik ini. Busur ini bertujuan untuk melunakkan transisi antar pivot sehingga membentuk struktur visual yang mirip dengan lengkungan kembar ("Golden Arches") 🏛️. - Zona Berwarna:
Jika diaktifkan, area digambar antara pivot pertama dan terakhir. Warna zona ini tergantung pada arah pola: -
- 🟢 Hijau: Tren bullish (jika pivot terakhir lebih tinggi).
- 🔴 Merah: Tren bearish (jika pivot terakhir lebih rendah).
- Skor Pola:
Menghitung persentase yang mencerminkan simetri dan kualitas busur. Skor yang lebih tinggi menunjukkan pola yang lebih terdefinisi dengan baik.
Apakah ini repainting (Replotting)? 🔄
Ya, indikator ini melakukan repaint. Ini berarti gambar dan deteksinya dapat berubah secara retroaktif saat data harga baru diperoleh. Hal ini karena identifikasi titik belok tersebut didasarkan pada pengamatan sejumlah bar setelah pembentukan pivot potensial. Oleh karena itu, apa yang tampak seperti busur yang dikonfirmasi dalam data historis bisa disesuaikan atau hilang saat diterapkan pada grafik langsung 📊.
Ini dapat digunakan sebagai bantuan pelengkap dalam analisis teknikal.
Bagaimana cara menggunakannya? 💡
- 📚 Analisis Backtesting:
Berguna untuk mempelajari pola historis dan mengevaluasi efektivitasnya pada berbagai aset atau kerangka waktu. - 👁️ Konfirmasi Visual:
Dapat melengkapi alat analisis lain (seperti support/resistance atau moving average) untuk memvalidasi potensi pembalikan. - 🎓 Pendidikan:
Membantu mengenali struktur pasar berdasarkan kurva Bézier, meskipun penggunaannya dalam trading langsung memerlukan verifikasi tambahan.
Batasan dan Rekomendasi ⚠️
- Penggunaan Waktu Nyata:
Karena melakukan repaint, indikator ini tidak boleh digunakan sebagai sinyal independen untuk masuk atau keluar pasar. - Optimasi:
Sesuaikan "Periode Mundur" menurut aset dan kerangka waktu untuk mengurangi sinyal palsu. - Konteks Pasar:
Bekerja terbaik di pasar yang sedang tren dan tidak pada pasar yang bergerak menyamping atau ranging.
Catatan Penting: 🚨
Karena bergantung pada data masa depan untuk konfirmasi, indikator ini sebaiknya digunakan terutama untuk menganalisis peristiwa yang sudah terjadi, seperti penurunan setelah pembukaan pasar atau latihan grafik edukasi, bukan untuk tujuan prediktif atau trading langsung. Meskipun pendekatannya inovatif, indikator ini harus digunakan bersama indikator dan analisis lain untuk menghindari sinyal palsu akibat sifat repainting-nya. Ini ideal untuk studi backtesting atau sebagai pelengkap edukasi dalam strategi trading.
Ringkasan
This tool repaints, meaning its visualizations and detections can change retroactively as new price data arrives, so it is best used for backtesting, educational purposes, or as a complementary aid alongside other technical analysis tools. It is optimized for trending markets and requires adjustment of the lookback period to suit different assets and timeframes. The indicator supports markets including Forex (e.g., EURUSD), commodities (e.g., XAUUSD), and cryptocurrencies (e.g., BTCUSD).


