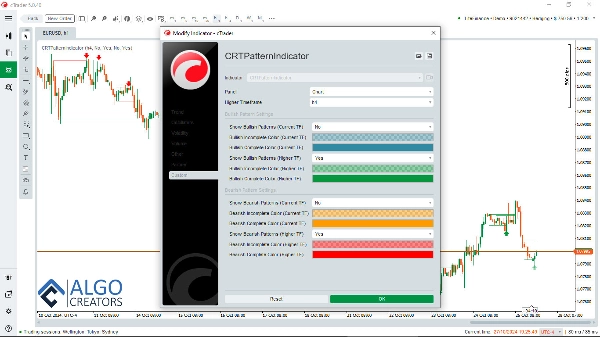
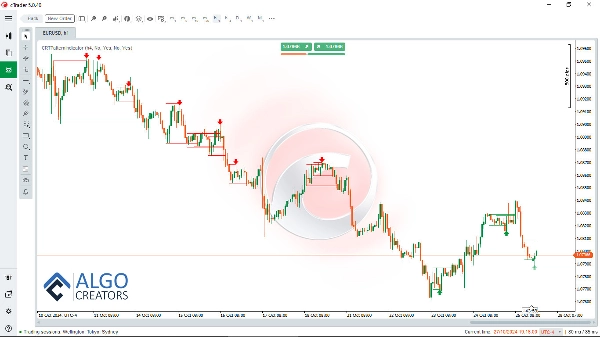
الوسطاء وشركات پروپ
للأعمال
00
Days
:
00
Hours
:
00
Minutes
:
00
Seconds
CRT Pattern Indicator
شعار "CRT Pattern Indicator"
منذ 28/09/2024
التثبيتات المجانية
6941
صورة "CRT Pattern Indicator" المحملةصورة "CRT Pattern Indicator" المحملة

The CRT (Candle Range Theory) indicator is a powerful analytical tool designed specifically for traders who follow the ICT (Inner Circle Trader) methodology. This indicator identifies essential candlestick patterns linked to the CRT, which is crucial for understanding market movements and price action.

The cTrader CRT indicator comes equipped with multi-timeframe capabilities, allowing traders to view higher timeframe (HTF) CRT patterns while operating on lower timeframes (LTF). This functionality is vital for gaining insights into overall market structure and improving trading decisions.


Price movement and ICT Power of 3 (AMD):
The CRT indicator simplifies the analysis of price movements and pattern recognition associated with ICT’s Power of 3 (Anatomy of Market Dynamics - AMD).

LTF CRT within a HTF CRT:
By effortlessly identifying the key points of support and resistance, traders can analyze price action with much greater clarity. Additionally, the CRT indicator highlights HTF and LTF patterns, helping traders navigate the dynamics of various market cycles.

use CRT indicator with other trading concepts:
Combining CRT with other trading concepts like FVGs, order blocks and turtle soup increases the probability of identifying successful trades.

Furthermore, the CRT indicator serves as an invaluable complement to the Smart Money Assistant indicator, an advanced tool designed to assist smart money traders with critical market insights and decision-making. Combined, these two indicators create a holistic trading toolbox that enhances the trader’s ability to analyze and act.

Download Smart Money Assistant: https://ctrader.com/algos/show/3956/

To further augment trading strategies, the FVG Finder indicator can be used alongside the CRT indicator. This tool detects Fair Value Gaps (FVGs) on the chart, which, when used in conjunction with CRT signals, increases the likelihood of making successful trades.

Download FVG finder indicator: https://ctrader.com/algos/show/3877/

By integrating these indicators, traders can establish a robust system that leverages high-probability setups, enabling them to effectively navigate the markets and optimize their trading outcomes.

Download CRT indicator with Alerts:: www[dot]AlgoCreators[dot]net

With the CRT, Smart Money Assistant, and FVG Finder in your toolkit, you can maximize your understanding of market trends and improve your overall trading performance, making it an essential resource for traders wishing to excel in the ICT trading style.

4.8
التقييمات: 10
5
80 %
4
20 %
3
0 %
2
0 %
1
0 %
تقييمات العملاء
November 6, 2025
September 30, 2025
August 24, 2025
I recommend it to both beginner and advanced traders. It helps a lot in the decision-making process.
August 4, 2025
Five stars! I love the indicator. It would be great if it can notify when a new arrow is printed.
July 9, 2025
Pros: Easy integration with cTrader, detects classic chart patterns automatically, flexible settings, clear visualization. Cons: No historical pattern statistics, possible false signals on lower timeframes, increased load with multiple instances.
July 3, 2025
June 27, 2025
perfect! can u tell me if it is possibale to get notification? and if i can make it cbot?
June 23, 2025
I downloaded yesterday. First trade today using it and it was fantastic!
June 17, 2025
good
May 5, 2025
Working just fine. How can I convert this into a bot?
المزيد من هذا المؤلف
الأعلى تقييمًا
مجاني
مؤشر
ATR
Forex
Signal
+4
Follow Line
The Follow Line Indicator is a versatile tool designed to identify market trends and provide accurate buy/sell signals.
قد يعجبك أيضًا
مؤشر
Indices
XAUUSD
Commodities
+5
Auto Signal Buy-Sell
Auto Signal BUY SELL is a professional decision-making tool designed to help you follow the trend and capture high-proba
مؤشر
NAS100
NZDUSD
Breakout
+14
ZIG ZAG Free
ZigZag Free is a clean swing-detection tool that marks significant pivot highs/lows
مؤشر
NAS100
NZDUSD
Indices
+9
Heatmap Pro
Heatmap Pro analiza la volatilidad, el volumen y la acción del precio para "pintar" tu gráfico con zonas de color.
مؤشر
NAS100
NZDUSD
Martingale
+25
Liquidity Cluster Order
Liquidity Cluster Order automatically detects and draws accumulation zones & distribution zones
مؤشر
Indices
RSI
ATR
+3
Divergency 1.1_withSourceCode
🔍 Divergence Indicator for cTrader (Update v1.1)
مؤشر
NAS100
NZDUSD
XAUUSD
+11
Liquidity Heatmap
Multi-timeframe liquidity heatmap. Visualizes pivot zones across 10 timeframes with density mapping for Smart Money trad
مؤشر
RSI
Breakout
XAUUSD
+4
Dynamic Market Structure Analysis of Turning Points
Identify market structure effortlessly with swing highs, lows, CHoCH, and BOS levels for smart trading decisions! 📊🔍"
مؤشر
Indices
Stocks
Commodities
+2
Volume Spread Analysis
VSA indicator analyzing volume, spread, and close location to detect supply/demand imbalances.
الأعلى تقييمًا
مجاني
مؤشر
Bollinger
E7 Indicators Free Overlays
Bollinger Band Cloud, Heiken Ashi, Trend Follower and Parabolic SAR.
MAMA CANDLES
This code implements the MESA Adaptive Moving Average (MAMA) indicator, it creates candles based on MAMA calculations.
مؤشر
NAS100
Indices
XAUUSD
+9
HAIQuantum_TheGameV2
This trading game allows you to explore and practice investment strategies in a real-time market data environment.
مؤشر
NAS100
Indices
NZDUSD
+9
Supply and Demand
Auto Supply and Demand Automatically identifies the zones of highest trading activity on your chart. 📊
Vishal Volume Profile v2.0
Volume Profile plots traded volume at each price level, highlighting high activity zones of precise support & resistance
مؤشر
NAS100
NZDUSD
Martingale
+22
Indicators Volume Profile 1
Taiz Pro Volume Profile مؤشر احترافي لتحليل الحجم (Volume Profile) يكشف عن مناطق الدعم والمقاومة الحقيقية التي يركز عليه
الأعلى تقييمًا
مجاني
High TF Plotter
Captra High TF Plotter visualizes high timeframe Bar on lower timeframe charts, highlighting with bull/bear colors.
مؤشر
Indices
RSI
XAUUSD
+5
cAlgoBuddy - Composite Index RSI
What Constance Brown did with the RSI was to input a momentum calculation within the RSI itself. This the Composite RSI.
مؤشر
NAS100
NZDUSD
Breakout
+14
Adaptive Trailing System
🚀 Adaptive trailing stop that uses logarithmic normalized volatility....
مؤشر
NAS100
NZDUSD
XAUUSD
+11
WT - RR Tool
Lightweight Risk-Reward Visualization Tool.