
Açıklama
🔥 Pinescritlabs
Ctrader Store göstergeleri: 🤖Pinescritlabs Ctrader Store cBots:
Fair Value Gap Sessions Gold & BTC Breakout Session Pivots
Dinamik Piyasa Yapısı
Dönüş Noktalarının Analizi
Fibonacci Lineer
Regresyon Çoklu Zaman Dilimi
Çok Katmanlı Mum Eğilimi
Takipçisi
Otomatik Destek ve
Direnç Trend Çizgileri
Tüm Destek ve
Direnç Seviyeleri
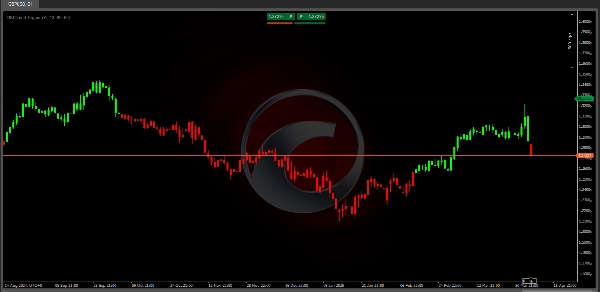
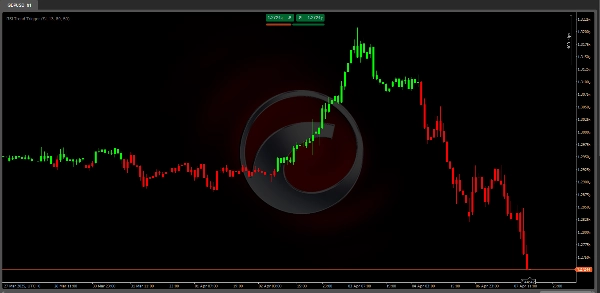
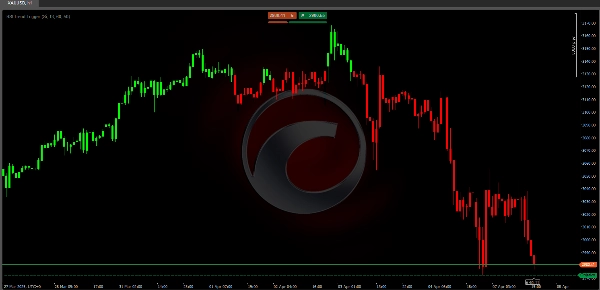
RSI Trend Tetikleyici 📈✨
Nasıl Çalışır? 🤔
Adım 1: Geleneksel RSI
Standart Göreceli Güç Endeksi (RSI) hesaplanır, belirli bir süre boyunca fiyat hareketlerinin hızını ve büyüklüğünü ölçer. 0 ile 100 arasında dalgalanır, aşırı alım koşullarını (örneğin, 70'in üzerinde) ve aşırı satım koşullarını (örneğin, 30'un altında) belirler. 📊📉📈
Adım 2: Dinamik İyileştirme
Geleneksel RSI, bir ileri düzey yumuşatma işleminden geçirilir:
- Orijinal RSI değerlerine (fiyatın kendisine değil) ikinci bir matematiksel hesaplama uygulanır.
- Bu adım, küçük dalgalanmaları (piyasa gürültüsü) azaltarak daha stabil bir RSI versiyonu oluşturur ve gerçek trendleri vurgular.
- Temel yumuşatmanın aksine, bu yöntem önemli momentum değişikliklerine karşı duyarlılığı korur ve aşırı gecikmeleri önler. 🛡️🔄
İyileştirmenin Önemi Nedir? 🤩
- Akıllı Filtreleme: Haber dalgalanmaları veya spekülatif hareketler gibi geçici volatilite kaynaklı yanlış sinyalleri ortadan kaldırır. �🗑️
- Daha Keskin Trendler: Çift hesaplama yaklaşımı, küçük düzeltmeler ile gerçek trend dönüşlerini ayırt eder. 🎯
- Kalıcı Sinyaller: Bir trend (boğa/ayı) onaylandığında, gösterge net bir dönüş olana kadar sinyali korur, düzensiz sinyal sıçramalarını önler. 🔒
Pratik Kullanım: Eşikler ve Karar Verme 📈
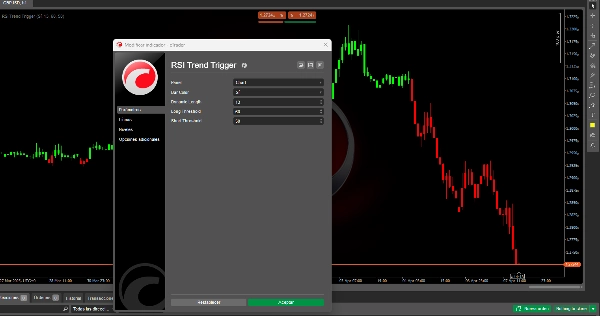
İyileştirilmiş RSI, iki ayarlanabilir eşik ile birleştirilir:
- Boğa Eşiği (örneğin, 60):
-
- İyileştirilmiş RSI bu seviyenin üzerine çıkarsa, bir boğa trendi onaylanır. 🚀
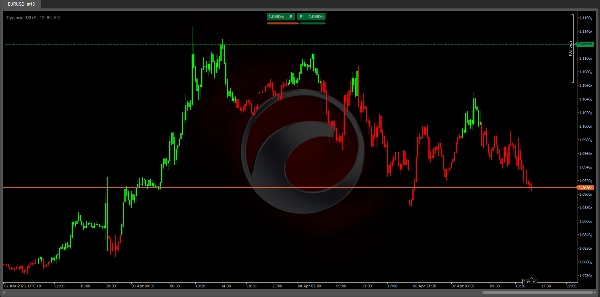
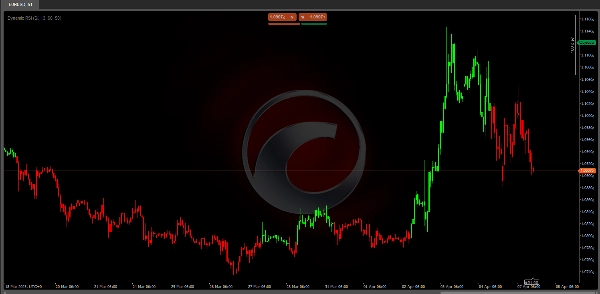
- Mumlar yeşile döner
- Ayı Eşiği (örneğin, 50):
-
- İyileştirilmiş RSI bu seviyenin altına düşerse, bir ayı trendi tetiklenir. 📉
- Mumlar kırmızıya döner
Temel Kural:
- Sinyaller sadece trend değişiklikleri sırasında görünür (her dalgalanmada değil), bilgi aşırı yüklemesini azaltır. 🚫📢
- Eşikler özelleştirilebilir: volatil piyasalar için daha yüksek değerler (örneğin, 65/55) veya daha yumuşak trendler için daha düşük değerler (örneğin, 55/45) kullanın. ⚙️
Tüccarlar İçin Faydalar 🏆
- Artırılmış Hassasiyet:
-
- Çift katmanlı filtreleme sayesinde daha az yanlış sinyal. Yanlamasına piyasalar veya sahte kırılmalar için ideal. ✅
- Sezgisel Görselleştirme:
-
- Renkli mumlar ve görsel eşikler sayesinde trendleri anında fark edebilirsiniz. 👀🎨
- Uyarlanabilirlik:
-
- Varlıklar (forex, hisse senetleri, kripto) ve zaman dilimleri (dakikalardan haftalara) arasında çalışır. 🌍⏳
- Trende Odaklı Ticaret:
-
- Riskli karşı trend hareketlerden kaçınarak momentuma göre işlem yapmaya yardımcı olur. 🎯🚦
Örnek Sinyal Akışı
İyileştirilmiş RSI'nın 55 (nötr bölge) olduğunu hayal edin:
- Boğa Senaryosu: 62'ye yükselir → 60 eşiğini aşar → Mumlar yeşile döner🚀
- Ayı Senaryosu: 48'e düşer → 50 eşiğini kırar → Mumlar kırmızıya döner📉
Özet
The indicator then applies an advanced smoothing process to the RSI values, not the price data, creating a refined RSI that reduces minor market noise while maintaining sensitivity to significant momentum changes. This dual-layer calculation enhances signal precision by filtering out false signals caused by temporary volatility and distinguishing between minor corrections and genuine trend reversals.
Users can customize two threshold levels—a bullish threshold (e.g., 60) and a bearish threshold (e.g., 50)—to define when a trend is confirmed. When the refined RSI crosses above the bullish threshold, the indicator signals a bullish trend with green candles; when it falls below the bearish threshold, it signals a bearish trend with red candles. Signals appear only during trend changes, reducing information overload.
The RSI Trend Trigger supports multiple timeframes from minutes to weeks and is adaptable to different market conditions, aiding traders in aligning with momentum and avoiding counter-trend risks.
Müşteri değerlendirmeleri
5 | 67 % | |
4 | 33 % | |
3 | 0 % | |
2 | 0 % | |
1 | 0 % |


