
Mô tả
- Nó làm gì (giá trị của nó).
- Nó giúp các nhà giao dịch như thế nào.
- Điều gì làm nó trở nên độc đáo.
- Cách sử dụng nó (tóm tắt).
- Phiên bản trả phí sẽ mở khóa những gì (gợi ý).
🔸
Chỉ báo Giờ Vàng Phiên
(Phiên bản Miễn phí)
Mô tả
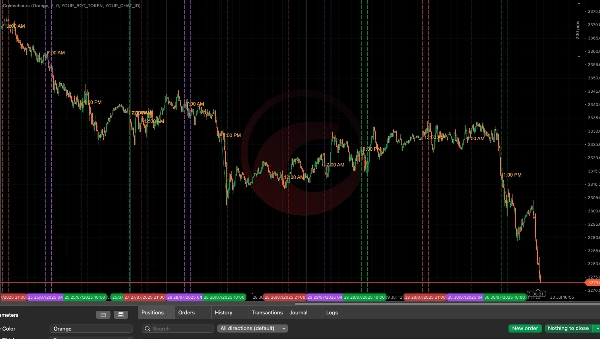
Chỉ báo Giờ Vàng Phiên được thiết kế cho các nhà giao dịch nghiêm túc muốn hình dung các khung giao dịch có xác suất cao dựa trên các mô hình thanh khoản theo phiên. Công cụ này tự động làm nổi bật các khoảng thời gian chính trong các phiên Châu Á, London và New York — thường được gọi là “giờ vàng” của thị trường — khi giá có khả năng phá vỡ khỏi vùng giá và thể hiện ý định của các tổ chức.
Nó làm gì:
- Theo dõi mức cao/thấp phiên Châu Á (00:00–08:00 UTC) để lập bản đồ các vùng thanh khoản.
- Làm nổi bật các giờ chính của London và New York như:
-
- Giờ trước đóng cửa London (06:00–07:00 UTC)
- Giờ đóng cửa London (07:00–08:00 UTC)
- Vùng quét buổi chiều NY (13:00–14:00 UTC)
- Vẽ các hướng dẫn trực quan trên biểu đồ của bạn để tập trung nhận thức về các giờ phá vỡ hàng ngày.
Nó giúp bạn như thế nào:
- Dễ dàng nhận biết các vùng quét thanh khoản trong các khoảng thời gian chồng lấn phiên.
- Tập trung quyết định giao dịch quanh khung thời gian tiền thông minh — không còn giao dịch trong các vùng chết.
- Nhận biết trực quan nơi các cú giả và đảo chiều thường xảy ra.
- Hoạt động trên bất kỳ công cụ nào và bất kỳ khung thời gian nào theo chu kỳ phiên toàn cầu.
Tính năng chính:
- Màu sắc, độ dày đường và mở rộng thời gian có thể điều chỉnh.
- Theo dõi phiên tự động không cần vẽ thủ công.
- Hỗ trợ tích hợp cho 15 ngày giao dịch gần nhất.
- Hình ảnh biểu đồ sạch sẽ, không gây cản trở.
Phù hợp cho:
- Các nhà giao dịch kiểu ICT (mô hình thanh khoản + thời gian)
- Các nhà giao dịch lướt sóng theo hành động giá
- Các nhà giao dịch sử dụng sự hội tụ theo thời gian
🔓 Muốn thêm?
Phiên Chuyên Nghiệp (Sắp ra mắt) bổ sung:
- Cảnh báo phá vỡ thời gian thực gửi trực tiếp đến Telegram
- Logic cho các cú giả Châu Á → đảo chiều London và mức cao/thấp London → đảo chiều NY
- Bộ đếm thời gian làm mát thông minh để tránh cảnh báo quá mức
- Theo dõi đầy đủ mức cao/thấp theo phiên kèm nhãn tín hiệu
- Lộ trình tương lai: cảnh báo FVG, vùng thanh khoản nội bộ và lọc tín hiệu
Tóm tắt
Hồ sơ chỉ báo
Đánh giá của khách hàng
4.0
Đánh giá: 1
5 | 0 % | |
4 | 100 % | |
3 | 0 % | |
2 | 0 % | |
1 | 0 % |
Thảo luận
Câu hỏi thường gặp
Các sản phẩm có sẵn trên cTrader Store, bao gồm bot giao dịch, chỉ báo và plugin, được cung cấp bởi các nhà phát triển bên thứ ba và chỉ nhằm mục đích cung cấp thông tin và tiếp cận kỹ thuật. cTrader Store không phải là nhà môi giới và không cung cấp lời khuyên đầu tư, khuyến nghị cá nhân hay bất kỳ đảm bảo nào về hiệu suất trong tương lai.


Giá
3
Cài đặt miễn phí